Skip to content

R for Journalists

Unlock the power of R

  • What Is R?
  • R for Rob
  • GitHub
  • Twitter
  • Etsy
  • Home
  • journalism
  • Page 2

Tag: journalism

How Taking the Bus Is A London Thing

Posted on October 23, 2016October 31, 2016 By Rob
How Taking the Bus Is A London Thing
See

In our previous two–part series we looked at the melt function from the reshape2 package. The creator of the package, Hadley Wickham, pointed me towards tidyr and the gather function as a better alternative instead.

Read More “How Taking the Bus Is A London Thing” »

Melting Drugs Data: Part Two

Posted on October 19, 2016October 31, 2016 By Rob
Melting Drugs Data: Part Two
See

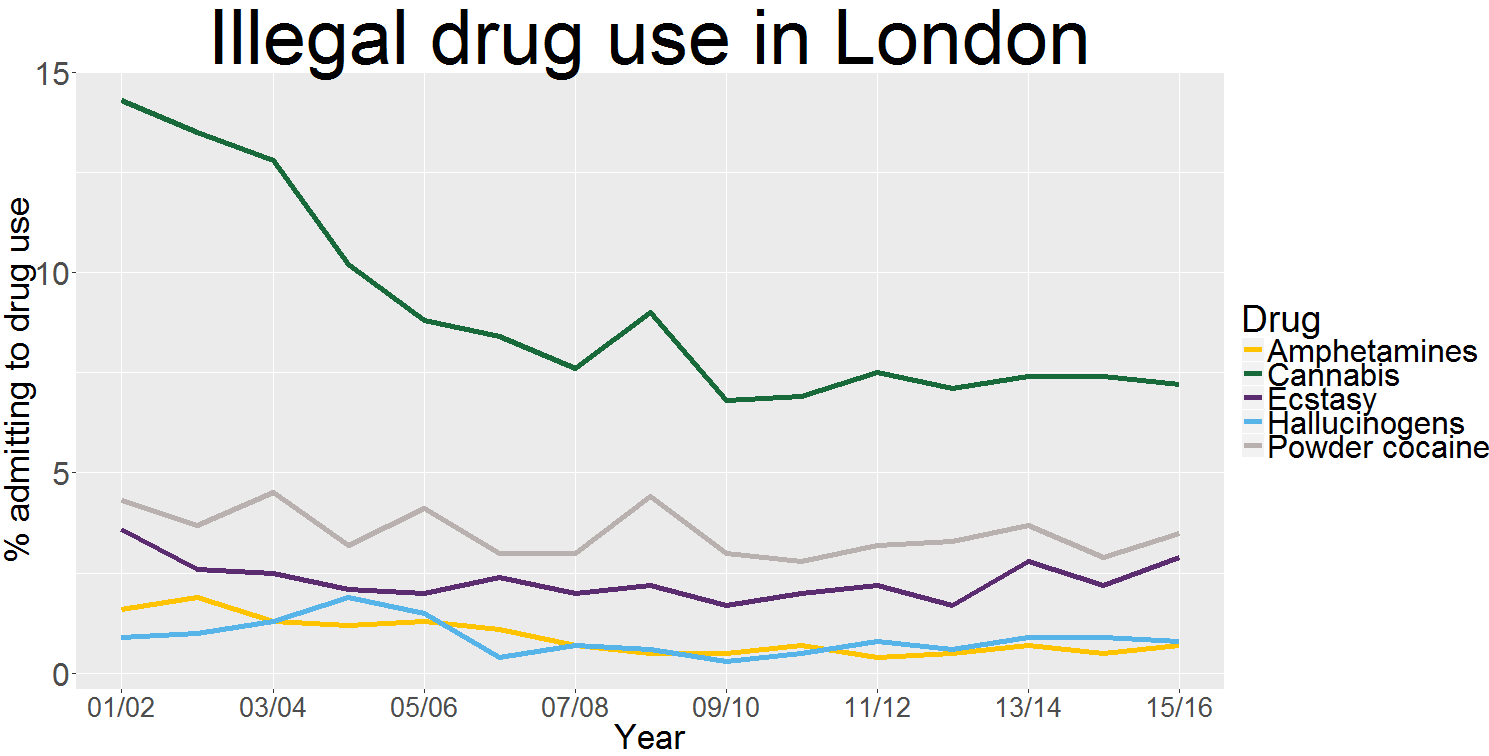
Before we begin: Hadley Wickham, the reshape2 package creator, pointed me in the direction of the tidyr package for melting data. I’ll take a look at it after this post. As promised from before, a look at @hadleywickham‘s reshape2 package and Home Office drugs data #ddj #rstats https://t.co/Q46eUijsaG — R For Journalists (@rforjournalists) October 18, … Read More “Melting Drugs Data: Part Two” »

Melting Drugs Data: Part One

Posted on October 18, 2016October 18, 2016 By Rob
See

foundry

Every year the Home Office, which is responsible for drugs policy, carries out an anonymous survey into use of illegal drugs in England and Wales.

Read More “Melting Drugs Data: Part One” »

Is Unemployment Higher under Labour or the Conservatives?

Posted on October 17, 2016October 31, 2016 By Rob
Is Unemployment Higher under Labour or the Conservatives?
See

In the last post we discussed annotations on line plots.

In this post, we are going to take it a step further and look at block annotations.

Read More “Is Unemployment Higher under Labour or the Conservatives?” »

How the North Has the Worst Mental Health in England

Posted on October 14, 2016October 14, 2016 By Rob
See

My colleagues and I at Trinity Mirror ranked mental health around England on Monday for World Mental Health Day.

We aggregated four datasets – depression, contact with mental health services, the recovery rate from anxiety and depression and antidepressant prescriptions – to produce a mental health ranking for all 209 Clinical Commissioning Groups (CCGs) in England.

Read More “How the North Has the Worst Mental Health in England” »

Visualising House Prices by Postcode in Leeds

Posted on October 9, 2016October 9, 2016 By Rob
See

house-prices-in-leeds2

After looking at Manchester’s flat boom, we’re going over t’Pennines to Leeds, or more accurately the LS postcode for Leeds and the surrounding area.

Read More “Visualising House Prices by Postcode in Leeds” »

Visualising the Boom in New Flats in Manchester

Posted on October 6, 2016October 6, 2016 By Rob
See
An example of new apartments in Salford. © Copyright Geoff Royle and licensed for reuse under this Creative Commons Licence.
New apartments in Salford.
© Copyright Geoff Royle and licensed for reuse under this Creative Commons Licence.

Any visitor to Manchester city centre will be struck by the number of modern blocks of city centre flats.

Take the tram out towards Altrincham and you’ll see modern apartment blocks on both sides, out towards Salford and back towards Castlefield.

Read More “Visualising the Boom in New Flats in Manchester” »

Make Your Labels Legible on Mobile

Posted on October 1, 2016October 2, 2016 By Rob
See

In my previous post, I showed how poorer children are more likely to be fat. Think about how your graphics look on a mobile phone before you publish them. I didn’t do this properly with my last post – I published it first and then checked how it looked on mobile. That isn’t the best approach – and it … Read More “Make Your Labels Legible on Mobile” »

How Poor Children Are More Likely To Be Fat

Posted on September 30, 2016October 1, 2016 By Rob
See

ncmp_v5

Poorer children are more likely to be fat.

As we move further to the right of the chart into schools in more deprived areas, the share of children in the grey and black parts of the chart – showing overweight and very overweight kids – gets bigger.

This means that a class of year six children in inner-city Manchester will likely have bigger waistlines than one in leafy Hampshire.

A combination of bad diets and a lack of exercise means poorer children are sadly more likely to be fat at just 10 or 11 years old, with all the health problems that brings now and stores up for the future.

Read More “How Poor Children Are More Likely To Be Fat” »

Posts pagination

Previous 1 2

Recent Posts

  • I’ve moved my blog over to Substack
  • How to plot a large rural area using Ordnance Survey data in R
  • Check the COVID-19 vaccination progress in your area
  • Let R tell you what to watch on Netflix
  • Sentiment analysis of Nineteen-Eighty-Four: how gloomy is George Orwell’s dystopian novel?

Archives

  • April 2022
  • April 2021
  • March 2021
  • February 2021
  • January 2021
  • December 2020
  • February 2020
  • December 2019
  • November 2019
  • October 2019
  • April 2018
  • March 2018
  • January 2018
  • December 2017
  • November 2017
  • October 2017
  • September 2017
  • August 2017
  • July 2017
  • May 2017
  • April 2017
  • March 2017
  • February 2017
  • January 2017
  • December 2016
  • November 2016
  • October 2016
  • September 2016

Categories

  • Geospatial data
  • Landmark Atlas
  • Learn
  • See
  • Seen Elsewhere
  • Site
  • Uncategorized

Copyright © 2025 R for Journalists.

Theme: Oceanly by ScriptsTown


Loading Comments...