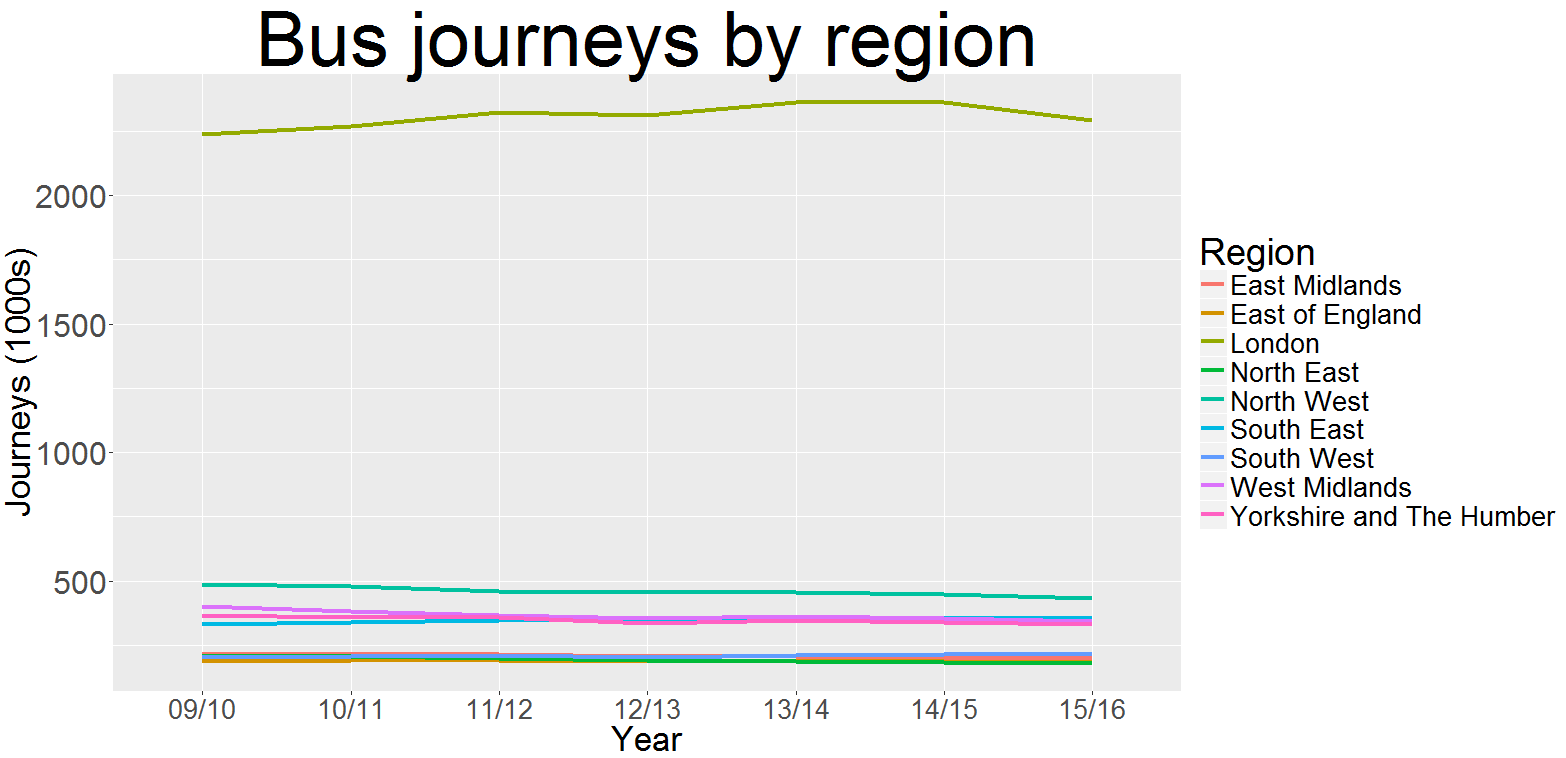

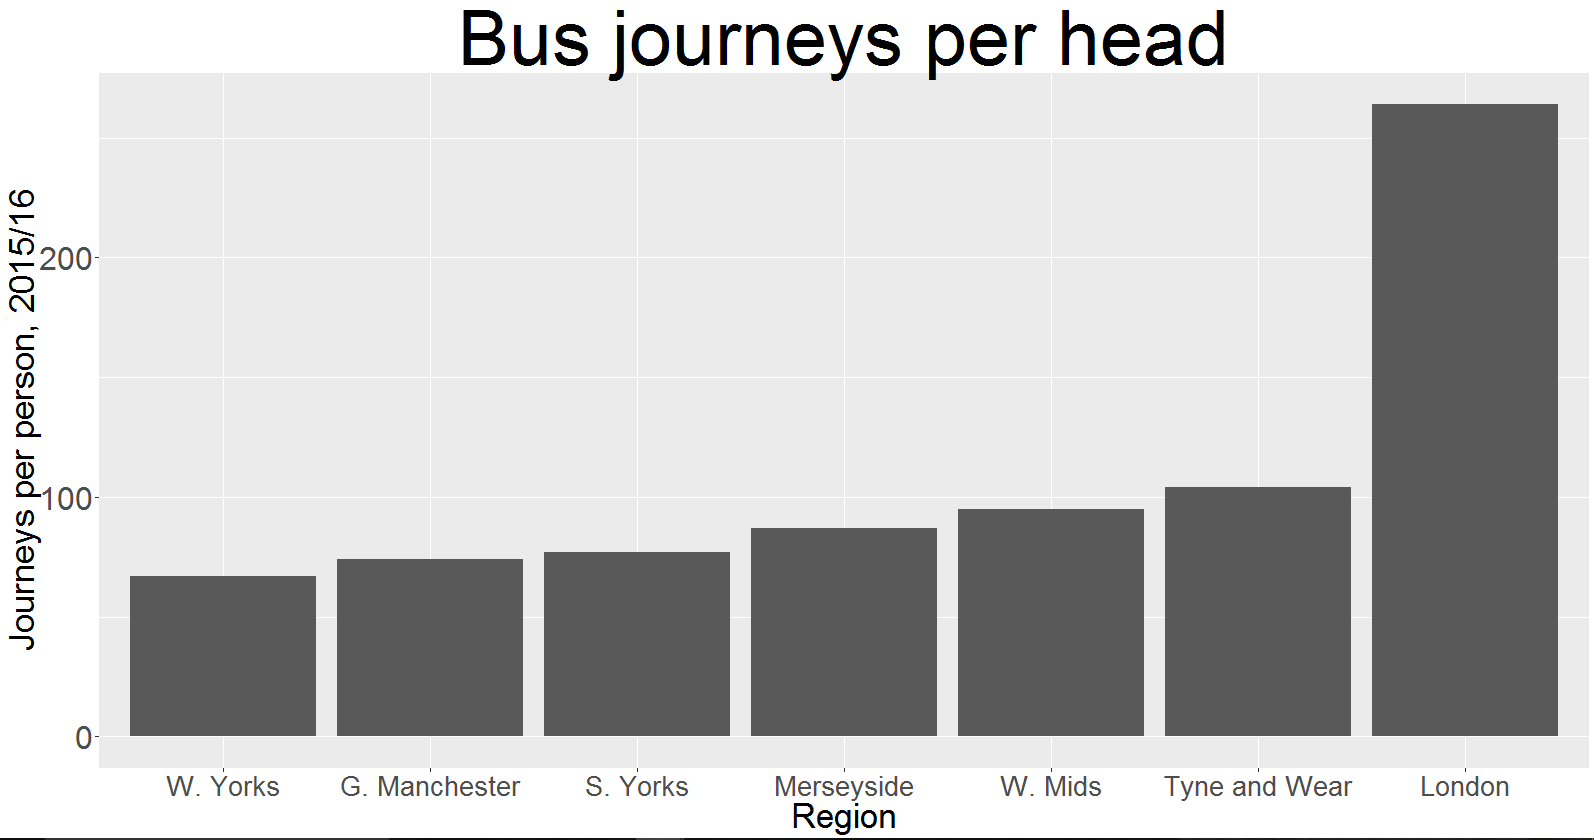
The last post came in for some criticism on /r/rstats, in particular from /u/fang_xianfu, who argued it merely showed that London has more people than the rest of the country.
See
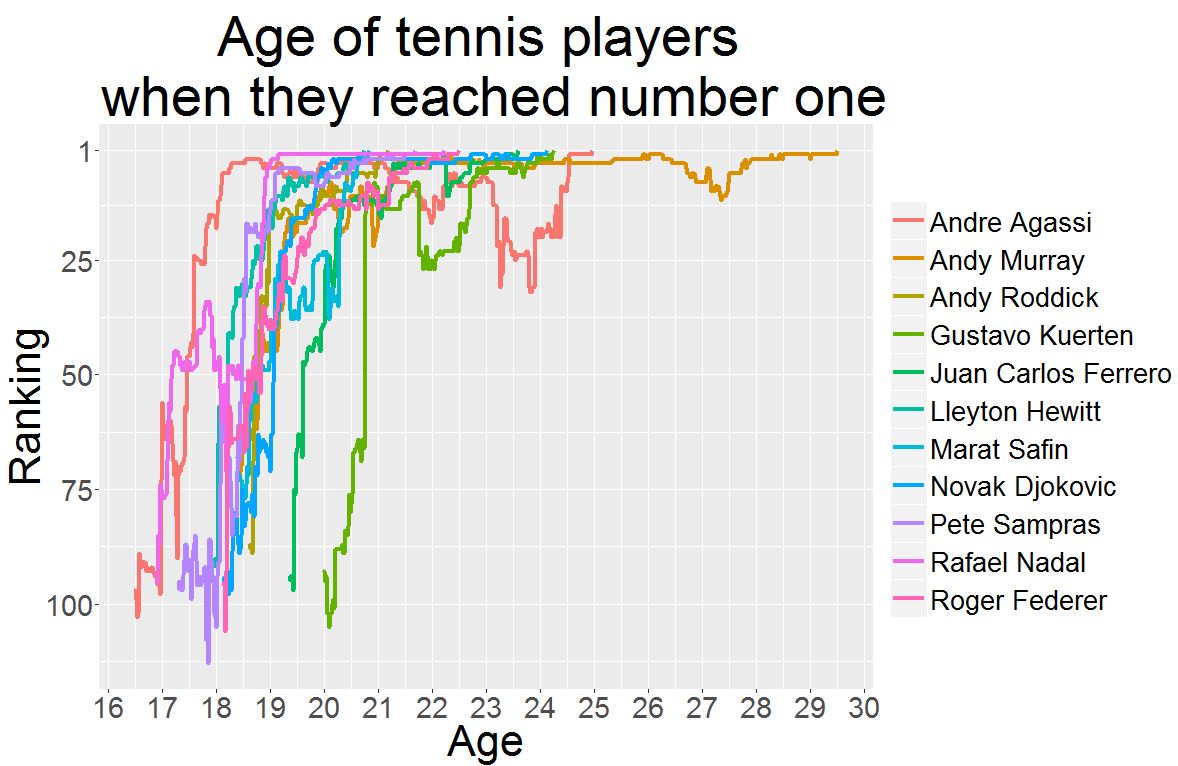
Andy Murray was crowned as the world number one in men’s tennis for the first time today. The two-time Wimbledon champion has long been out on his own as Britain’s best male tennis player and now he’s managed to overhaul Novak Djokovic at the summit of the game. It took Andy Murray a lot longer … Read More “Andy Murray’s Long Road to the Top” »