Skip to content

R for Journalists

Unlock the power of R

  • What Is R?
  • R for Rob
  • GitHub
  • Twitter
  • Etsy
  • Home
  • 2016
  • Page 2

Year: 2016

Asylum Seekers Are Usually Housed Away from London and the South East (Unless They Are Unaccompanied Children)

Posted on October 27, 2016October 27, 2016 By Rob
See

Walking through what’s left of the heart of the Jungle. The camp ‘Main St’ pic.twitter.com/8tYau41NST

— Gavin Lee (@GavinLeeBBC) October 26, 2016

With the Calais Jungle being broken up and most of the migrants there sent elsewhere in France, it seems a good time to return to the topic of asylum (although there is a difference between asylum and migration).
Read More “Asylum Seekers Are Usually Housed Away from London and the South East (Unless They Are Unaccompanied Children)” »

R for Journalists Is Now on Google+

Posted on October 25, 2016 By Rob
Site

You can find me here on Google+, with a slightly smaller profile pic to fit in with Google’s circular profile pictures. The last time I used Google+ was when I was training to be a journalist about four years ago, when it was a bit of a ghost town in terms of UK journalism. My … Read More “R for Journalists Is Now on Google+” »

Londoners Take the Bus Far More Often Than the Rest of England (Adjusted for Population)

Posted on October 24, 2016October 31, 2016 By Rob
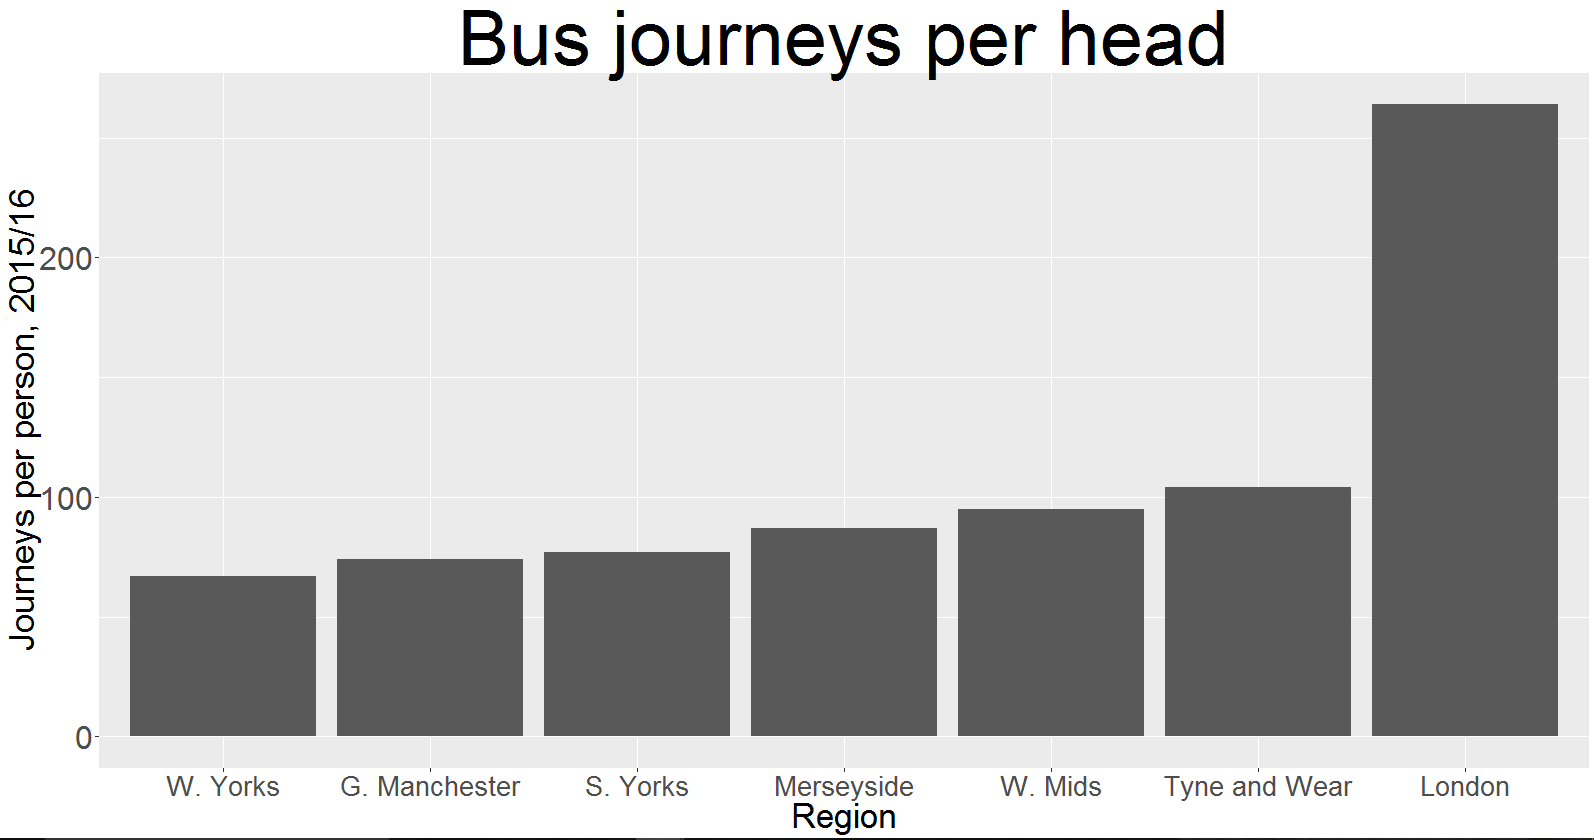
Londoners Take the Bus Far More Often Than the Rest of England (Adjusted for Population)
See

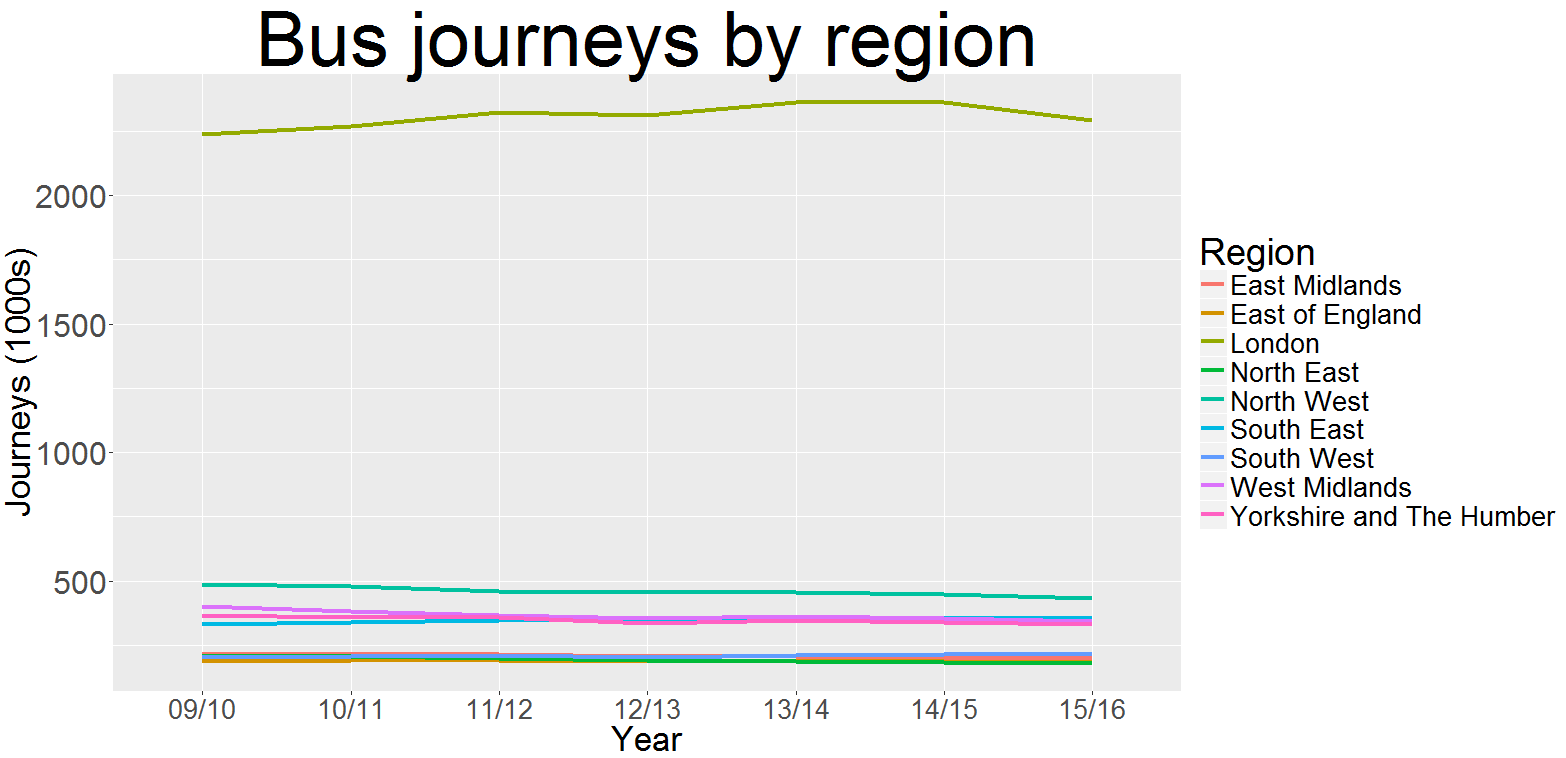
The last post came in for some criticism on /r/rstats, in particular from /u/fang_xianfu, who argued it merely showed that London has more people than the rest of the country.

Read More “Londoners Take the Bus Far More Often Than the Rest of England (Adjusted for Population)” »

How Taking the Bus Is A London Thing

Posted on October 23, 2016October 31, 2016 By Rob
How Taking the Bus Is A London Thing
See

In our previous two–part series we looked at the melt function from the reshape2 package. The creator of the package, Hadley Wickham, pointed me towards tidyr and the gather function as a better alternative instead.

Read More “How Taking the Bus Is A London Thing” »

Seen Elsewhere: 21st October 2016

Posted on October 21, 2016October 31, 2016 By Rob
Seen Elsewhere: 21st October 2016
Seen Elsewhere

I thought I’d start a weekly round-up of good uses of R I’ve seen elsewhere. We’ll start with four links this Friday: ComputerWorld’s R resources Cheat Sheet Longhow Lam’s use of scraping to show how cars lose value after you begin to rack up the miles Patrick Scott’s analysis of Donald Trump and Hillary Clinton’s choices of words in … Read More “Seen Elsewhere: 21st October 2016” »

Review: DataCamp Introduction to R

Posted on October 20, 2016October 31, 2016 By Rob
Review: DataCamp Introduction to R
Learn

I took this free course as my first real introduction to the R programming language.

I would highly recommend it for any beginner who wants a comprehensive overview of R.

Read More “Review: DataCamp Introduction to R” »

Melting Drugs Data: Part Two

Posted on October 19, 2016October 31, 2016 By Rob
Melting Drugs Data: Part Two
See

Before we begin: Hadley Wickham, the reshape2 package creator, pointed me in the direction of the tidyr package for melting data. I’ll take a look at it after this post. As promised from before, a look at @hadleywickham‘s reshape2 package and Home Office drugs data #ddj #rstats https://t.co/Q46eUijsaG — R For Journalists (@rforjournalists) October 18, … Read More “Melting Drugs Data: Part Two” »

Melting Drugs Data: Part One

Posted on October 18, 2016October 18, 2016 By Rob
See

foundry

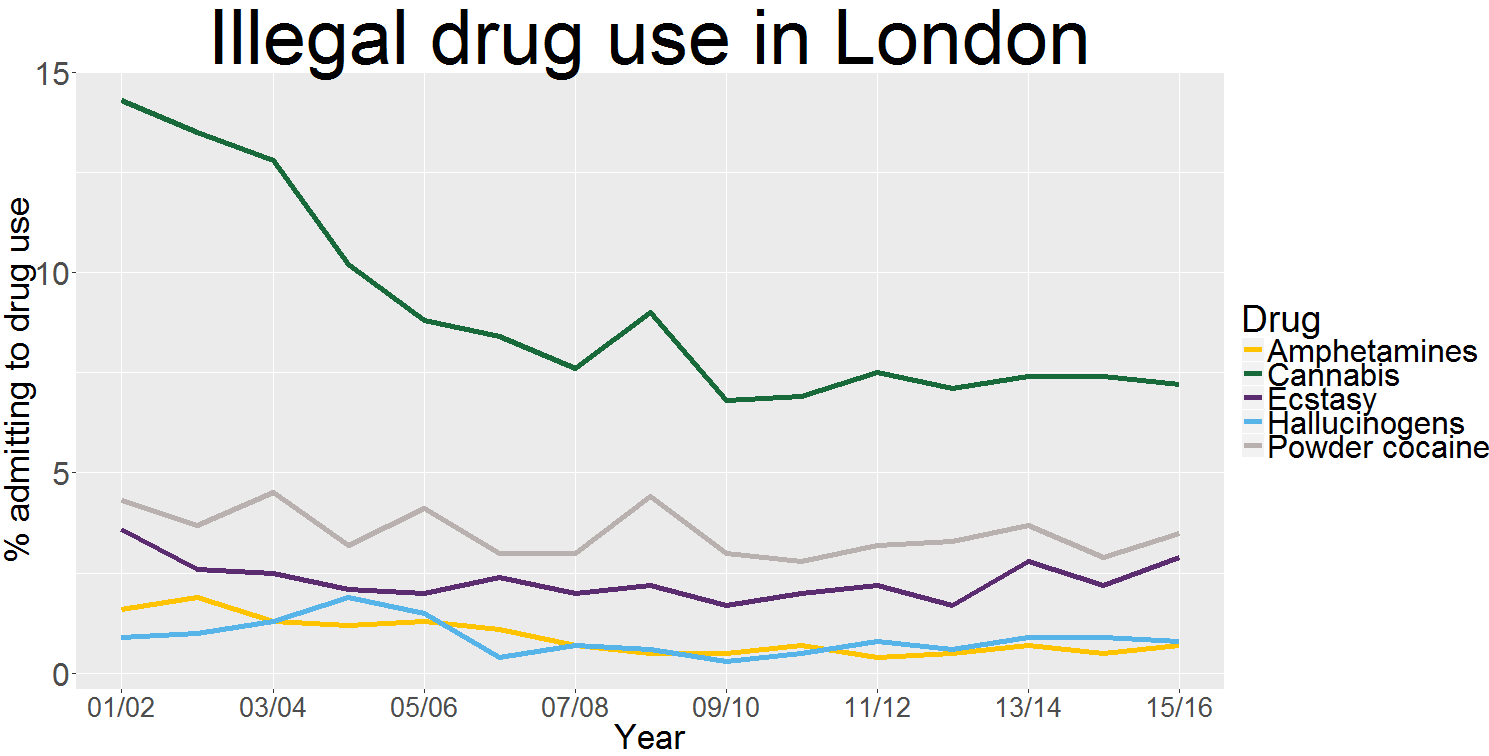
Every year the Home Office, which is responsible for drugs policy, carries out an anonymous survey into use of illegal drugs in England and Wales.

Read More “Melting Drugs Data: Part One” »

Is Unemployment Higher under Labour or the Conservatives?

Posted on October 17, 2016October 31, 2016 By Rob
Is Unemployment Higher under Labour or the Conservatives?
See

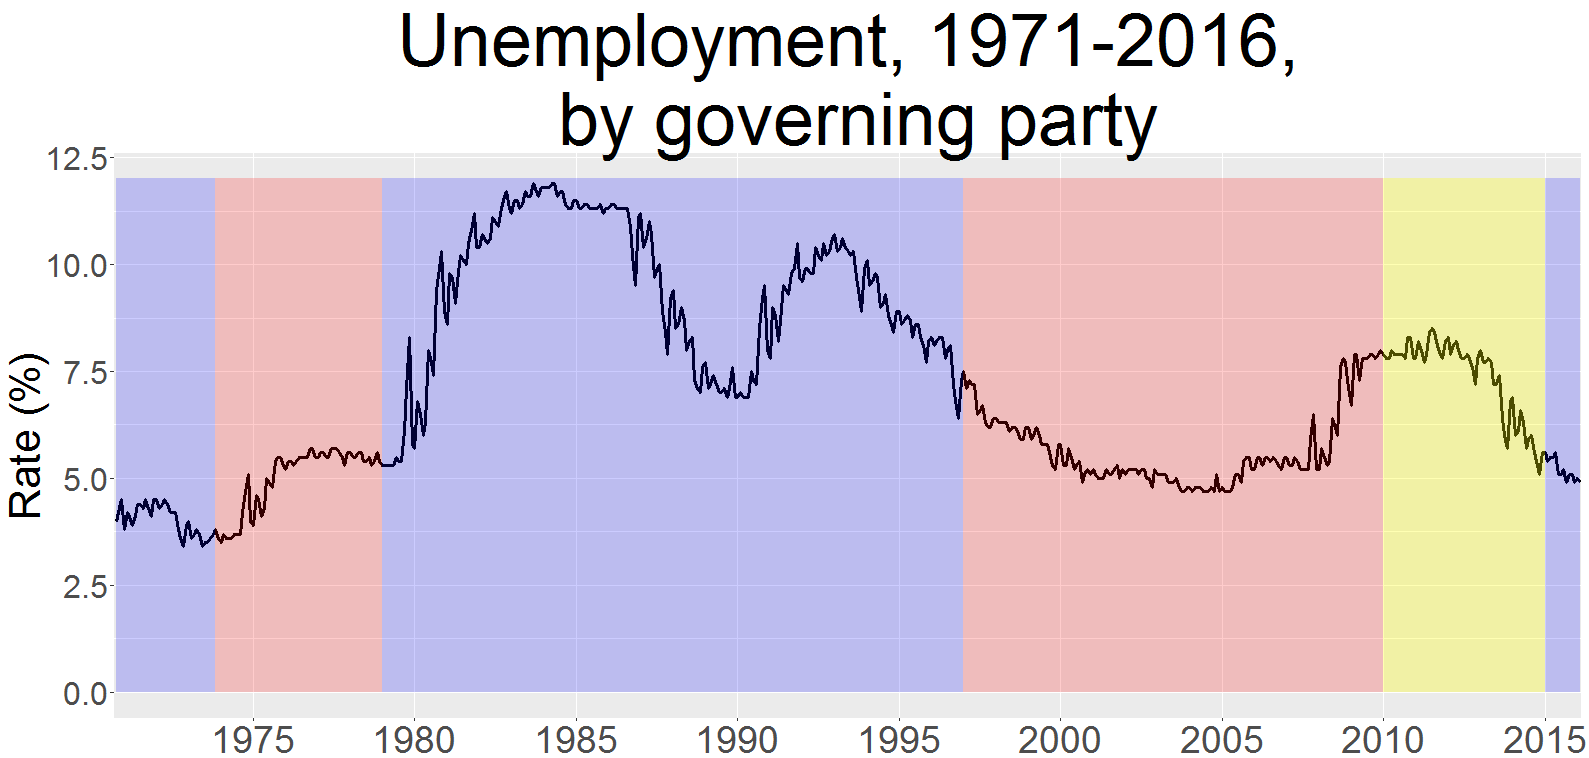
In the last post we discussed annotations on line plots.

In this post, we are going to take it a step further and look at block annotations.

Read More “Is Unemployment Higher under Labour or the Conservatives?” »

The History of Strikes in Britain, Told Using Line Plots and Annotations

Posted on October 15, 2016October 16, 2016 By Rob 2 Comments on The History of Strikes in Britain, Told Using Line Plots and Annotations
See

Strikes don’t really happen too much in Britain any more. A total of 170,000 working days were lost in Britain due to strikes and industrial action in 2015. That might sound like a lot, but it was actually the second lowest on record. And this record goes back to 1891 – one of the longest … Read More “The History of Strikes in Britain, Told Using Line Plots and Annotations” »

Posts pagination

Previous 1 2 3 Next

Recent Posts

  • I’ve moved my blog over to Substack
  • How to plot a large rural area using Ordnance Survey data in R
  • Check the COVID-19 vaccination progress in your area
  • Let R tell you what to watch on Netflix
  • Sentiment analysis of Nineteen-Eighty-Four: how gloomy is George Orwell’s dystopian novel?

Archives

  • April 2022
  • April 2021
  • March 2021
  • February 2021
  • January 2021
  • December 2020
  • February 2020
  • December 2019
  • November 2019
  • October 2019
  • April 2018
  • March 2018
  • January 2018
  • December 2017
  • November 2017
  • October 2017
  • September 2017
  • August 2017
  • July 2017
  • May 2017
  • April 2017
  • March 2017
  • February 2017
  • January 2017
  • December 2016
  • November 2016
  • October 2016
  • September 2016

Categories

  • Geospatial data
  • Landmark Atlas
  • Learn
  • See
  • Seen Elsewhere
  • Site
  • Uncategorized

Copyright © 2025 R for Journalists.

Theme: Oceanly by ScriptsTown


Loading Comments...