Learn
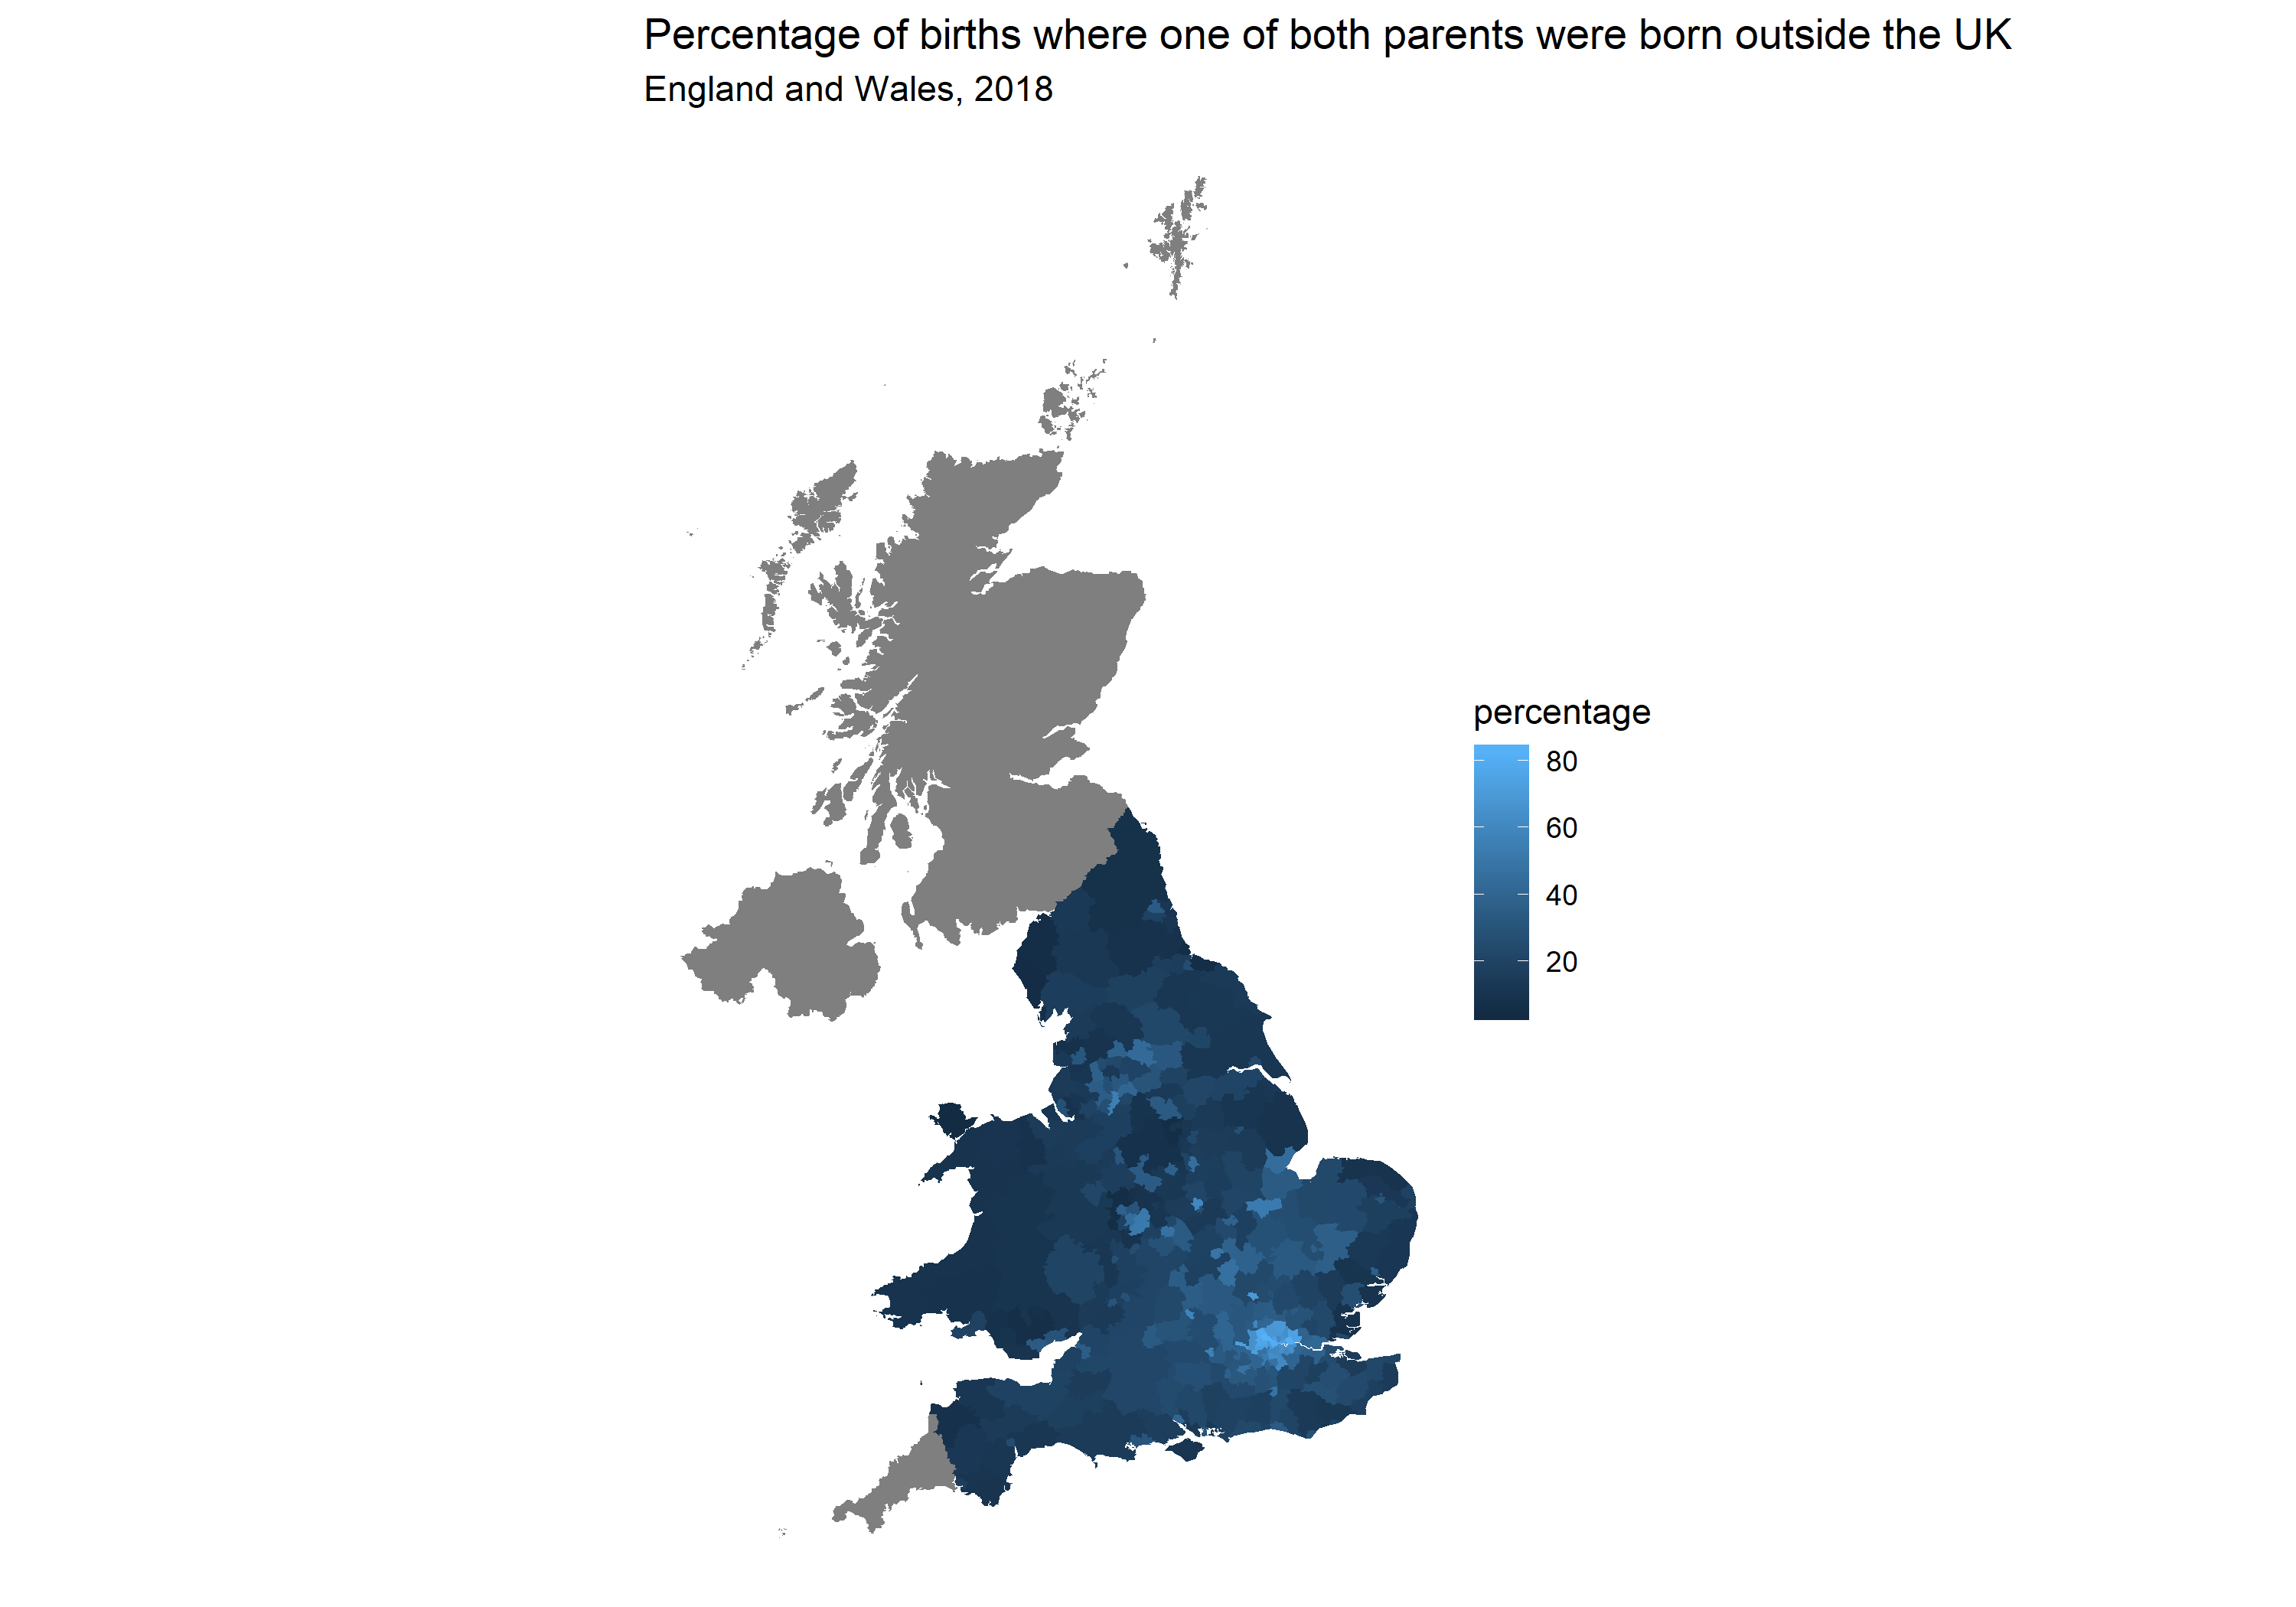
Particularly useful in the time of COVID-19 – how visualise different local rates around the UK.
Unlock the power of R
Particularly useful in the time of COVID-19 – how visualise different local rates around the UK.
On Tuesday I gave a workshop at the Data Journalism UK conference, run by Paul Bradshaw. This was the worked example for absolute beginners that we went through. If you’ve never looked at R before and want to run some R code, load up this page , copy the following in step by step … Read More “R for Absolute Beginners” »
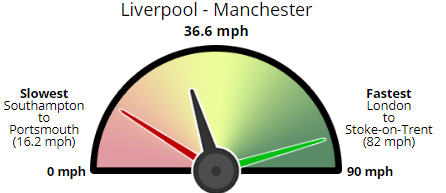
Earlier this month Marie Segger, Carlos Novoa and I had a major new project published about different rail speeds between cities around Britain. We compared the distances between train stations in Britain’s largest cities and found which areas were poorly-served by slow trains. Our project was picked up by a MP for Plymouth, a city … Read More “Calculating Distances in R: How Fast is Your Train?” »
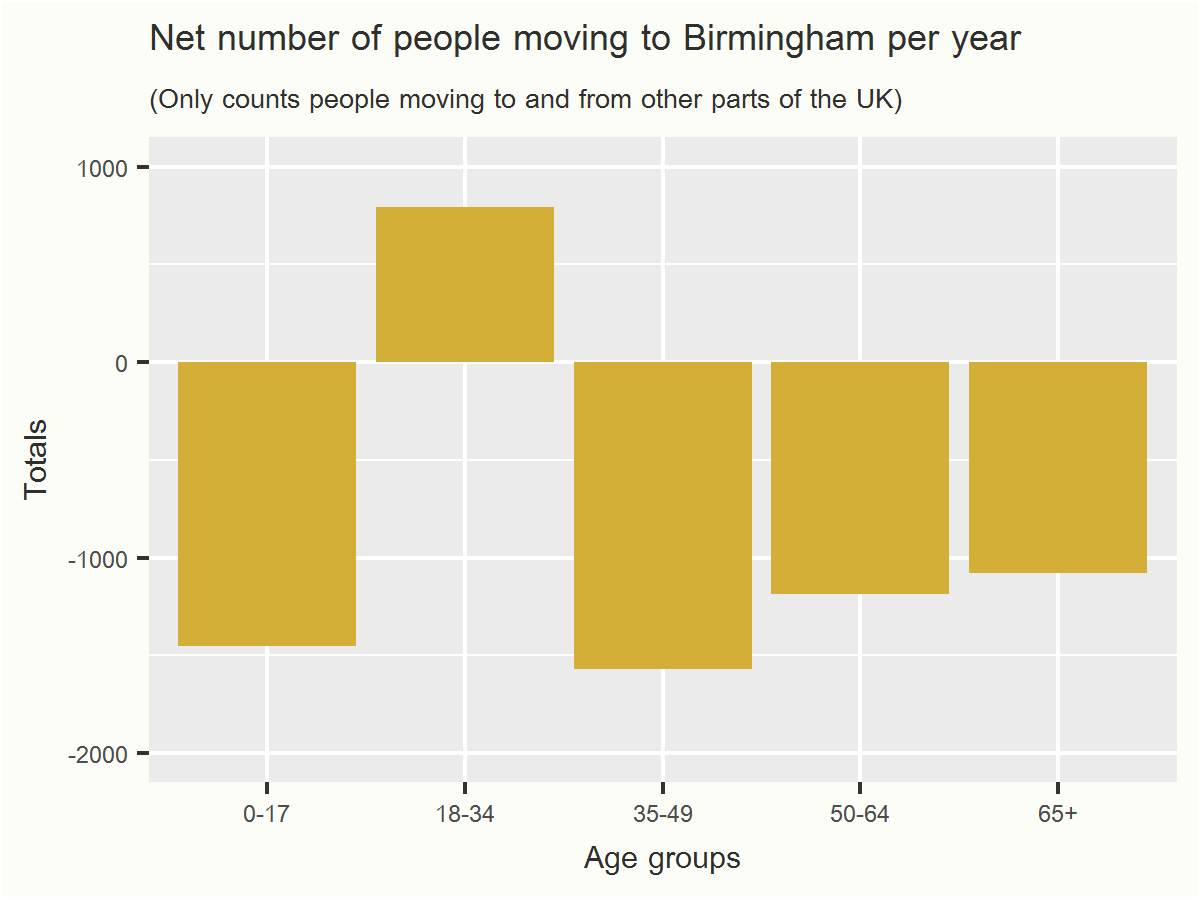
Introduction In Part I we looked at overall internal migration local authority by local authority – are more people coming than going? In Part II we looked at where people are moving from and to around the country. Here in the final Part III we will look at the ages of people moving in and out. … Read More “Internal Migration Part III: Plotting Age Groups” »
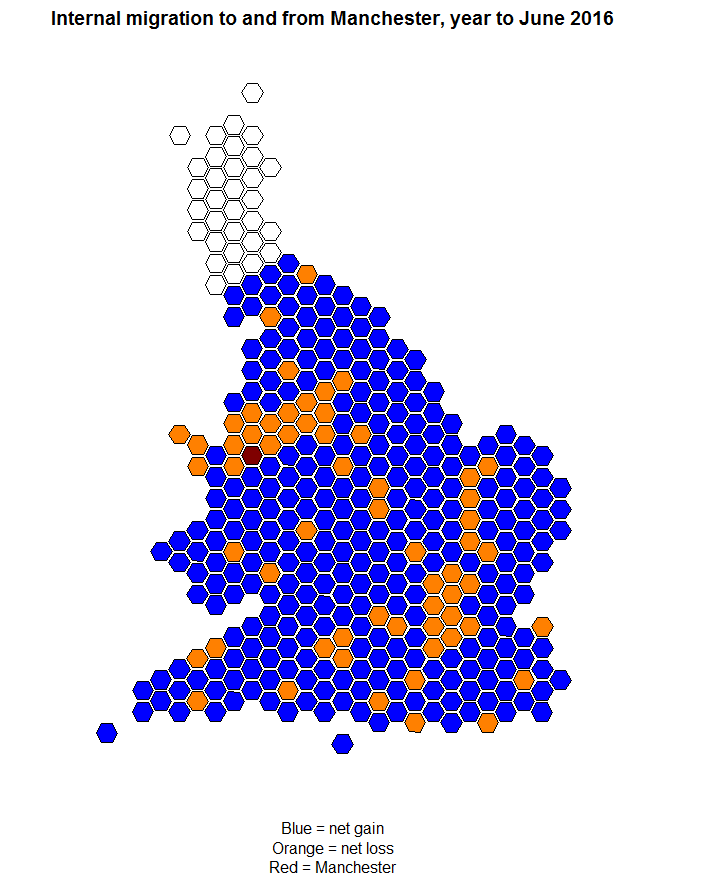
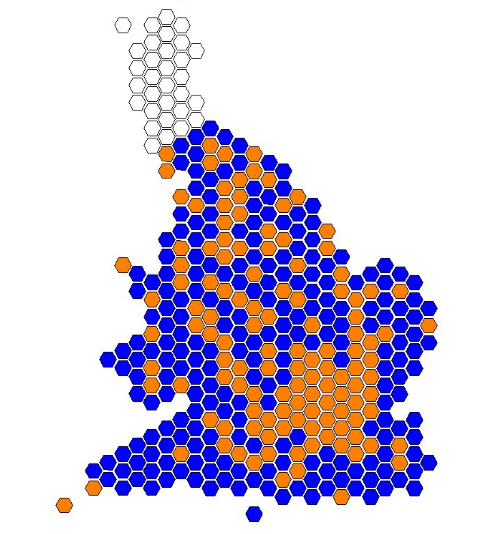
In the first post we completed a hexagonal map showing internal migration at a glance around England and Wales in 2015/16. This map is very good for an overview of what’s going on around the country – is your area getting more people from or losing people to other parts of Britain? But it doesn’t … Read More “Internal Migration, Part II: Homing in on individual authorities” »
The Office for National Statistics published some of its most interesting data last week – internal migration. This is the movement of people within the UK of people who are already here, not counting people immigrating or emigrating from abroad. The ONS publishes its headline estimates and also the full underlying data, containing each possible … Read More “Internal Migration, Part I: Hexagonal maps of movement of people” »
At work I’ve been working on a project called Find My Seat, which is now live. You type in your postcode and it presents you with lots of useful data about the economy, healthcare, immigration and Brexit in your area. I pulled all the data used in the widget together. One task I had … Read More “Practice with For Loops: Calculating Mean Ages” »
Like other departments the Ministry of Justice publishes spending data worth more than £25,000. It does this both for itself and for its executive agencies like the National Offender Management Service (NOMS) which runs the prison system. It does this monthly. A typical spreadsheet looks like this in R: dec <- read.csv(“noms-spend-december-2016.csv”) str(dec) ‘data.frame’: 14006 obs. … Read More “Using R to make Freedom of Information requests” »
This is a quick tip to avoid having to use the setwd() function to set your working directory all the time. Assuming you are working on a PC using RStudio, here is how to change your working directory to a R sub-folder. To do this, I made use of this guide. Step 1: Go to C:\Program Files\R\[your_version]\etc … Read More “How to Set Your Working Directory in RStudio on a PC” »
Last week I wrote some stories about cyclists involved in accidents while undertaking. The stories generated a LOT of comment and debate – both far more and far more negative than I was expecting. I’ll address that in a moment, but first, here’s a useful exercise in how to get the Government’s STATS19 data and filter down to … Read More “Cyclists Involved in Accidents Undertaking” »