Skip to content

R for Journalists

Unlock the power of R

  • What Is R?
  • R for Rob
  • GitHub
  • Twitter
  • Etsy
  • Home
  • football

Tag: football

Machine Learning in R: Using nearest neighbours to work out Premier League footballers’ positions

Posted on November 23, 2019December 22, 2020 By Rob
Learn

A dive into machine learning in R

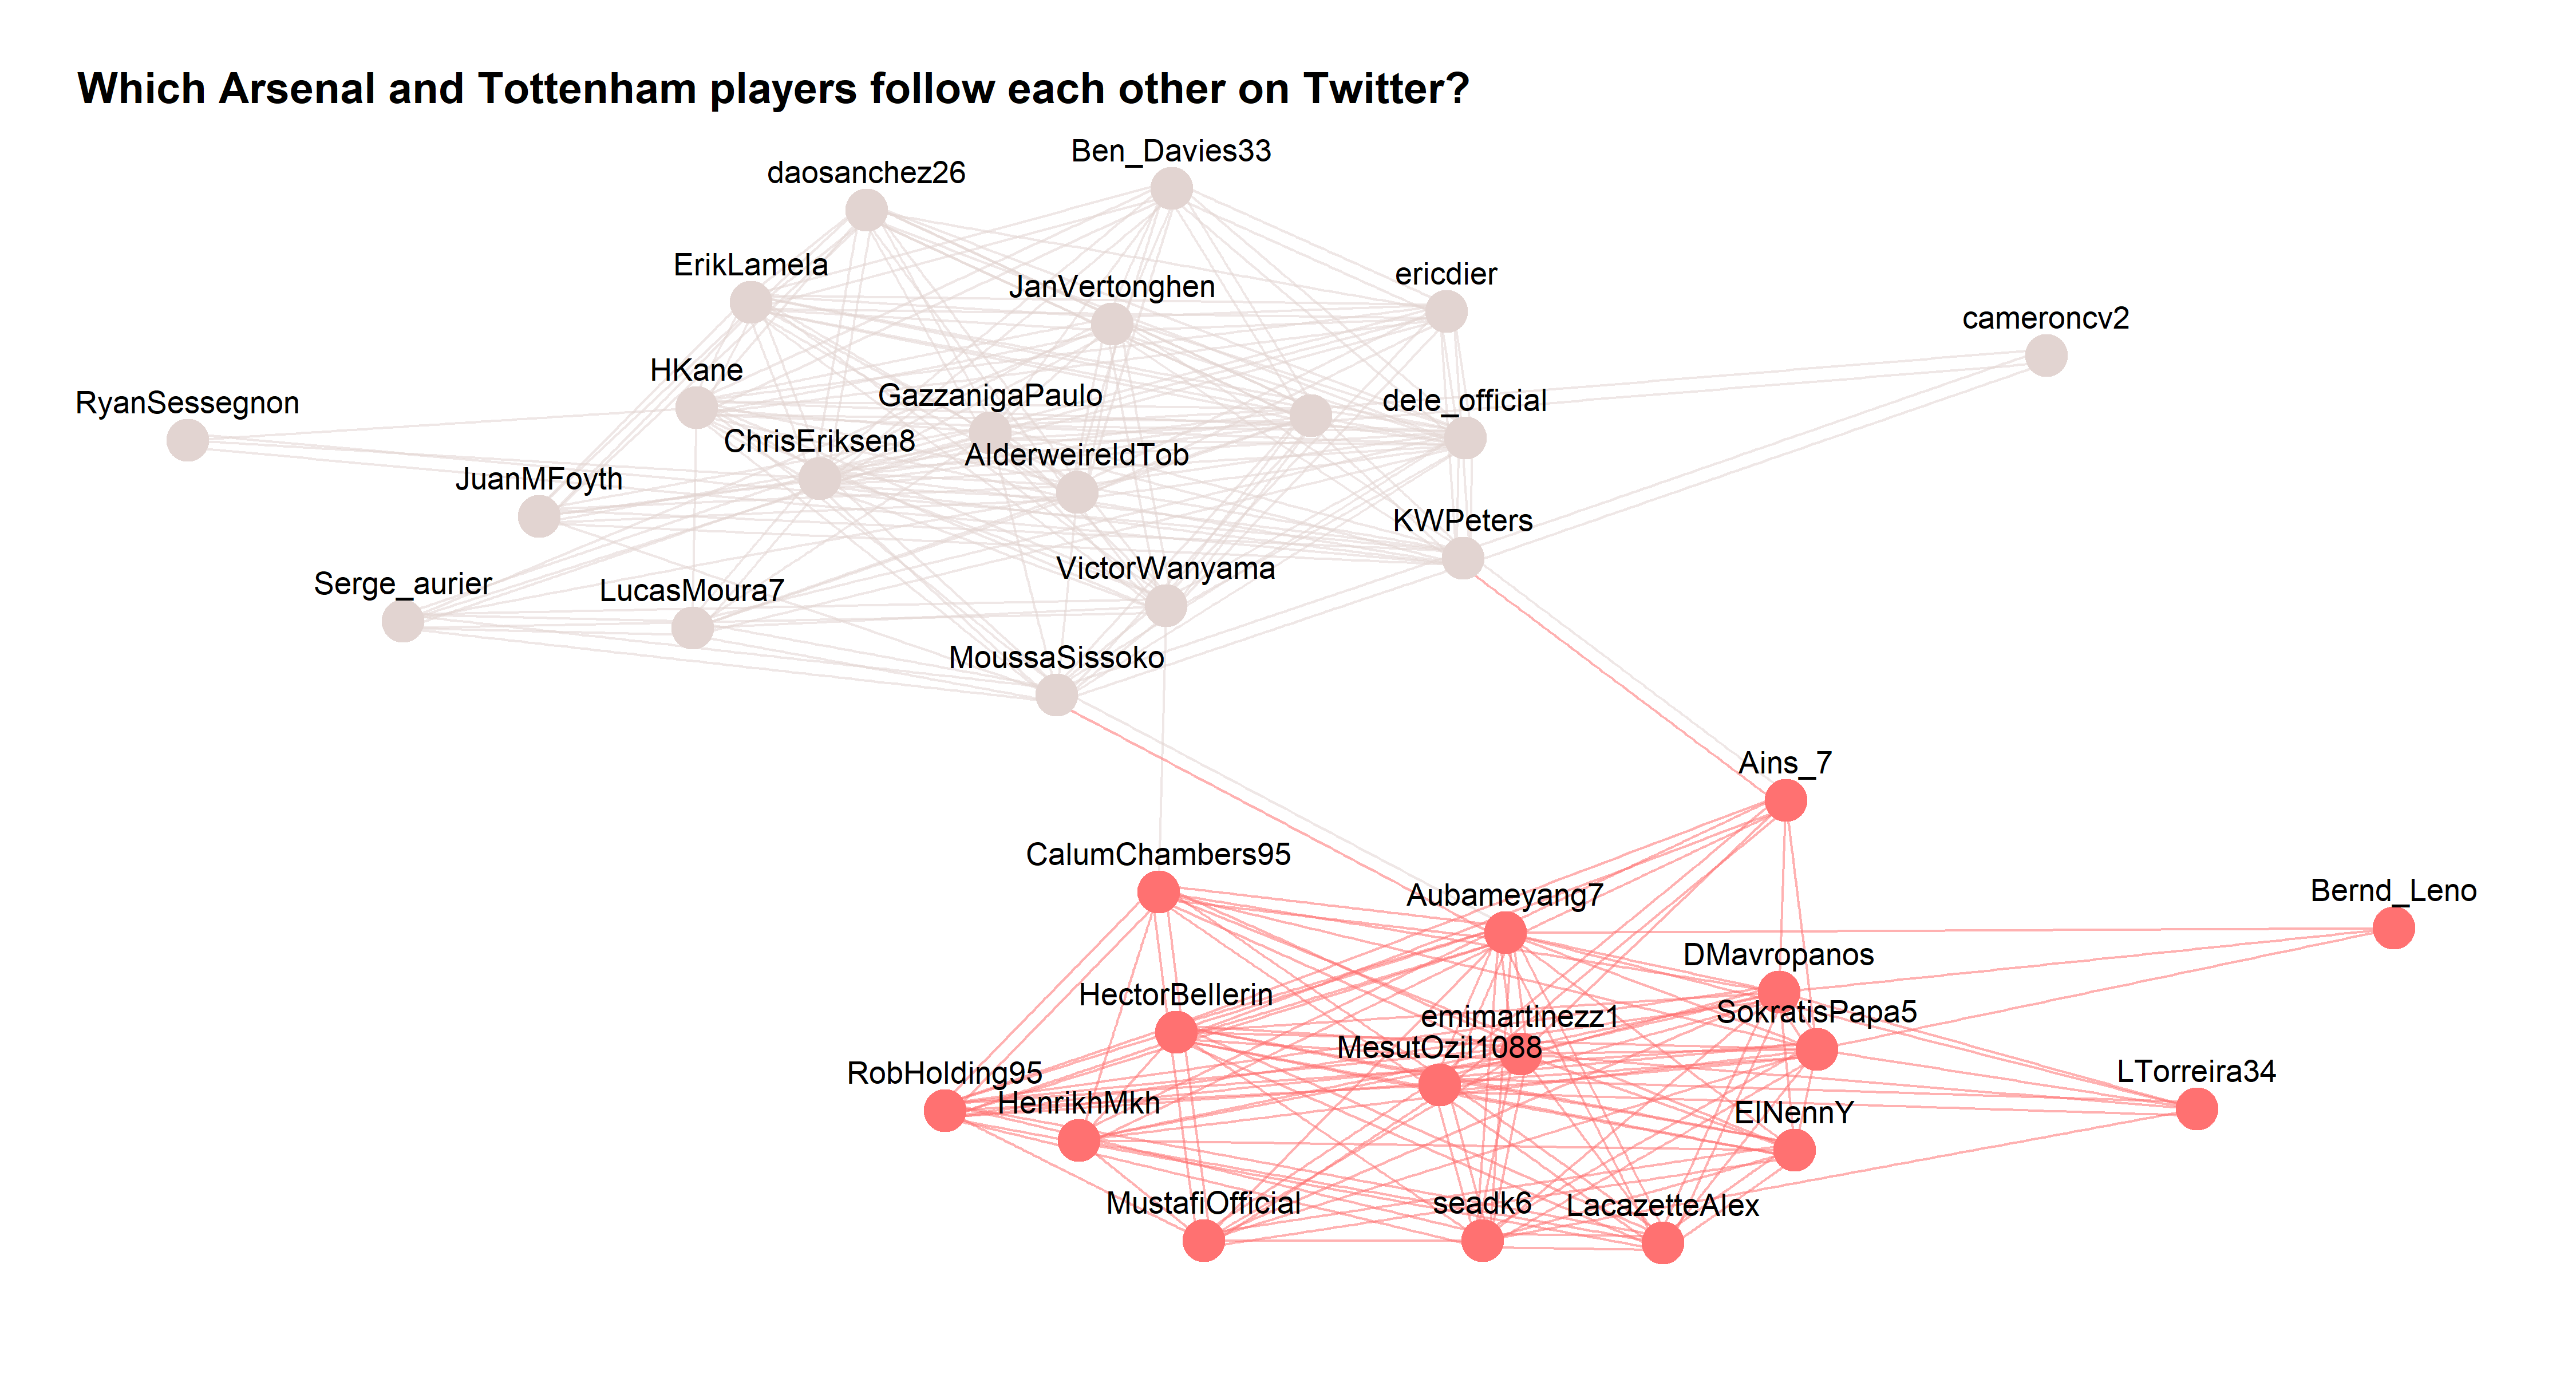
Which Arsenal and Tottenham Hotspur players follow each other on Twitter?

Posted on November 9, 2019December 22, 2020 By Rob
Which Arsenal and Tottenham Hotspur players follow each other on Twitter?
Learn

Do any of these footballing rivals follow each other on social media?

My First Shiny App Part II: The Shiny code itself

Posted on January 21, 2018 By Rob
See

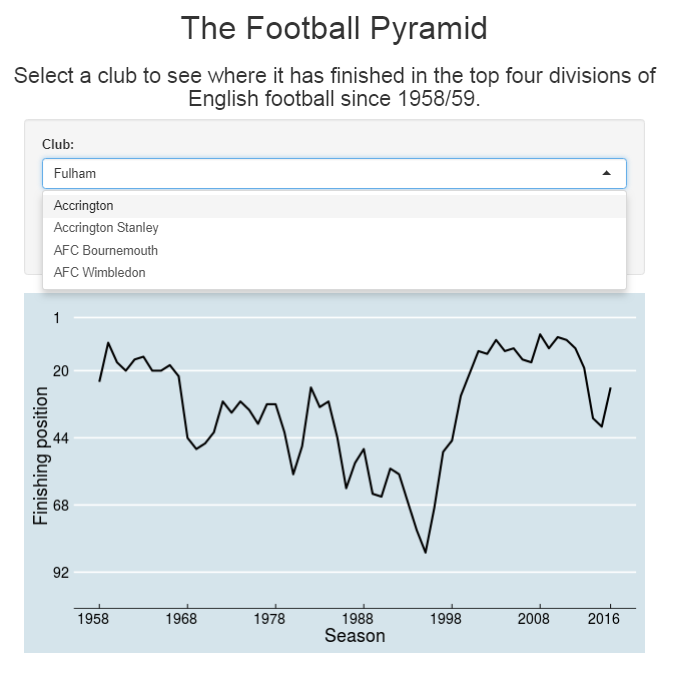
Recap In the last post we got to the stage where we had the data for each club’s league positions since 1958/59 in a Google sheet. The next step is to visualise this data in a Shiny app. Shiny lets you create visualisations that your users can interact with, and they have slightly different code … Read More “My First Shiny App Part II: The Shiny code itself” »

My First Shiny App: See Where Your Team Ranks in the Football Pyramid

Posted on December 31, 2017January 22, 2020 By Rob
My First Shiny App: See Where Your Team Ranks in the Football Pyramid
See

Here is my first Shiny app! Shiny lets you create interactive visualisations in R. It’s a big step forward from the static visualisations we have done thus far. R has a fairly steep learning curve at the beginning. It took me several months and a DataCamp course before I began to know what I was … Read More “My First Shiny App: See Where Your Team Ranks in the Football Pyramid” »

Where Does Your Team Rank in the Boxing Day League table?

Posted on December 26, 2016 By Rob 1 Comment on Where Does Your Team Rank in the Boxing Day League table?
Where Does Your Team Rank in the Boxing Day League table?
See

Boxing Day is the most wonderful time of year for football fans. In Britain we have a traditional busy calendar of fixtures the day after Christmas. Television dictates that the matches no longer all kick off at 3pm on 26th December but this year we have 16 of the 20 Premier League clubs playing today. So … Read More “Where Does Your Team Rank in the Boxing Day League table?” »

Creating a Premier League Results Matrix in R

Posted on September 24, 2016October 1, 2016 By Rob
See

On Wikipedia’s page for the 2015/16 Premier League, it has a matrix table of results.

It shows you all the results for each team, home and away against each other.

For example, if you look at Arsenal on Row 1, they beat Aston Villa 4-0 at the Emirates but lost their home match against Chelsea 0-1.
Read More “Creating a Premier League Results Matrix in R” »

Recent Posts

  • I’ve moved my blog over to Substack
  • How to plot a large rural area using Ordnance Survey data in R
  • Check the COVID-19 vaccination progress in your area
  • Let R tell you what to watch on Netflix
  • Sentiment analysis of Nineteen-Eighty-Four: how gloomy is George Orwell’s dystopian novel?

Archives

  • April 2022
  • April 2021
  • March 2021
  • February 2021
  • January 2021
  • December 2020
  • February 2020
  • December 2019
  • November 2019
  • October 2019
  • April 2018
  • March 2018
  • January 2018
  • December 2017
  • November 2017
  • October 2017
  • September 2017
  • August 2017
  • July 2017
  • May 2017
  • April 2017
  • March 2017
  • February 2017
  • January 2017
  • December 2016
  • November 2016
  • October 2016
  • September 2016

Categories

  • Geospatial data
  • Landmark Atlas
  • Learn
  • See
  • Seen Elsewhere
  • Site
  • Uncategorized

Copyright © 2025 R for Journalists.

Theme: Oceanly by ScriptsTown


Loading Comments...