Skip to content

R for Journalists

Unlock the power of R

  • What Is R?
  • R for Rob
  • GitHub
  • Twitter
  • Etsy
  • Home
  • circles

Tag: circles

Spring Budget 2017: Circle visualisation

Posted on October 1, 2017 By Rob
Spring Budget 2017: Circle visualisation
See

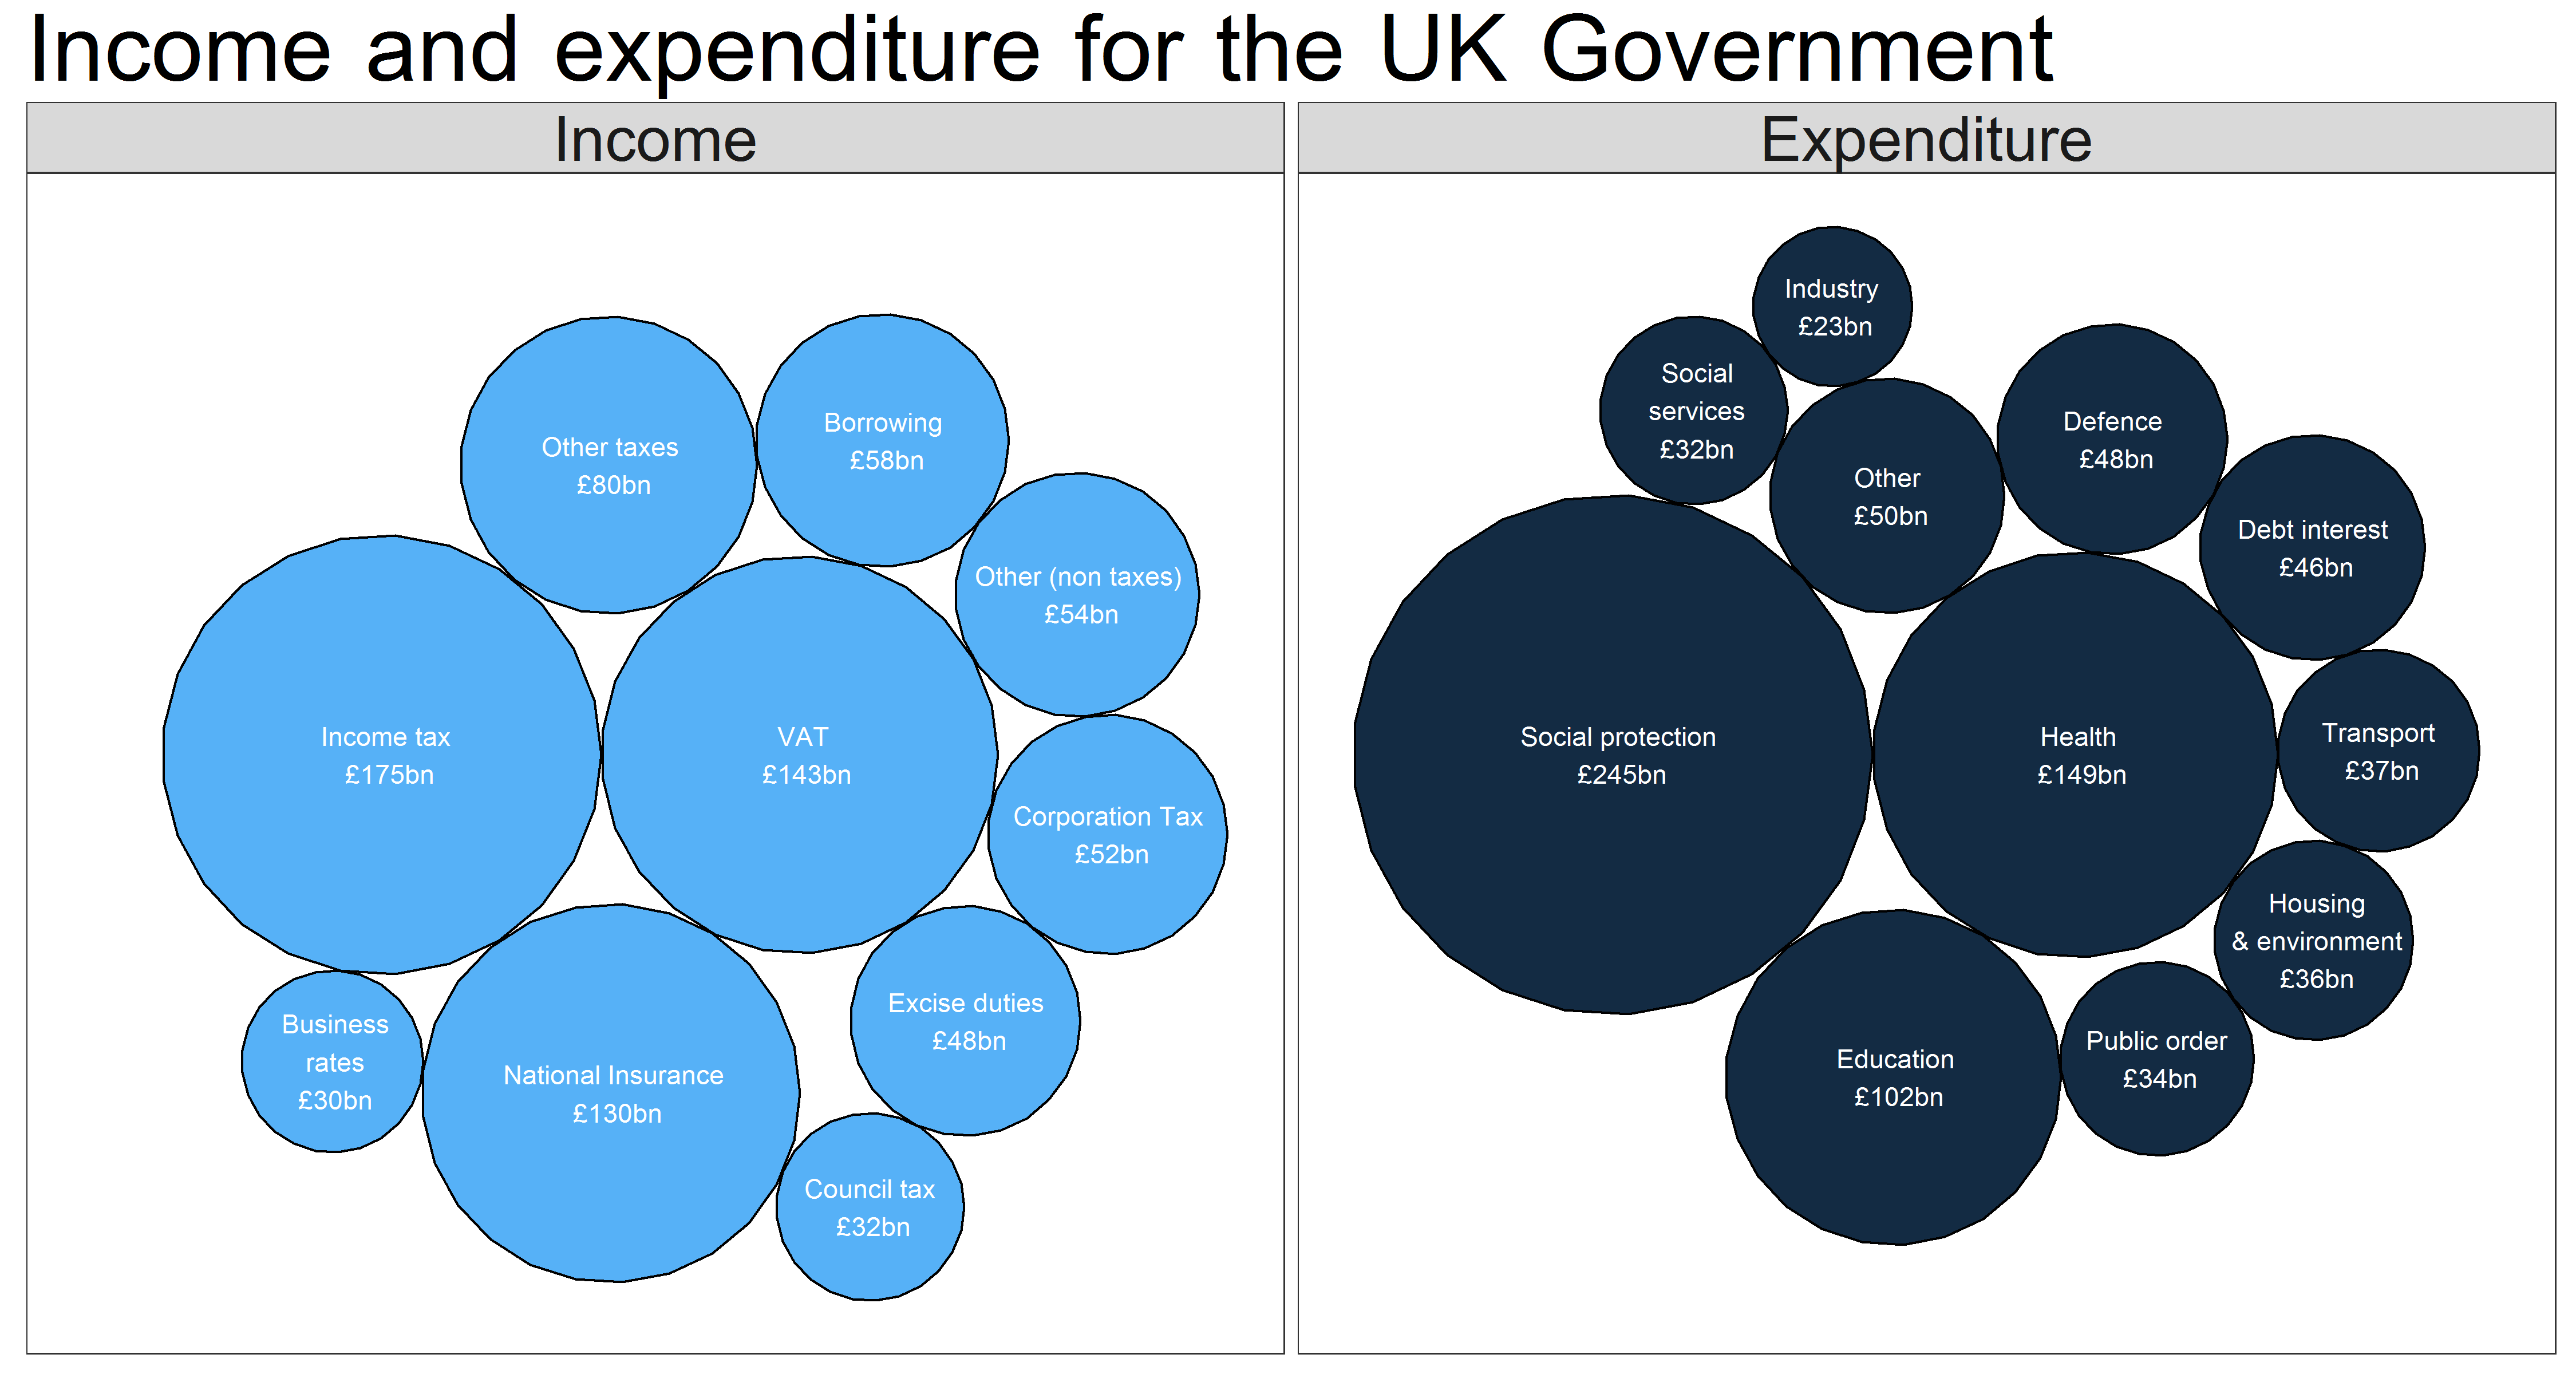
It’s time to branch out into a new area of data visualisation: proportion area plots. These plots use area to show proportion between different related values. A common type of proportional area plots are tree maps. We are going to be using the same principle but with circles. A common subject for area visualisation is … Read More “Spring Budget 2017: Circle visualisation” »

Recent Posts

  • I’ve moved my blog over to Substack
  • How to plot a large rural area using Ordnance Survey data in R
  • Check the COVID-19 vaccination progress in your area
  • Let R tell you what to watch on Netflix
  • Sentiment analysis of Nineteen-Eighty-Four: how gloomy is George Orwell’s dystopian novel?

Archives

  • April 2022
  • April 2021
  • March 2021
  • February 2021
  • January 2021
  • December 2020
  • February 2020
  • December 2019
  • November 2019
  • October 2019
  • April 2018
  • March 2018
  • January 2018
  • December 2017
  • November 2017
  • October 2017
  • September 2017
  • August 2017
  • July 2017
  • May 2017
  • April 2017
  • March 2017
  • February 2017
  • January 2017
  • December 2016
  • November 2016
  • October 2016
  • September 2016

Categories

  • Geospatial data
  • Landmark Atlas
  • Learn
  • See
  • Seen Elsewhere
  • Site
  • Uncategorized

Copyright © 2025 R for Journalists.

Theme: Oceanly by ScriptsTown


Loading Comments...