See
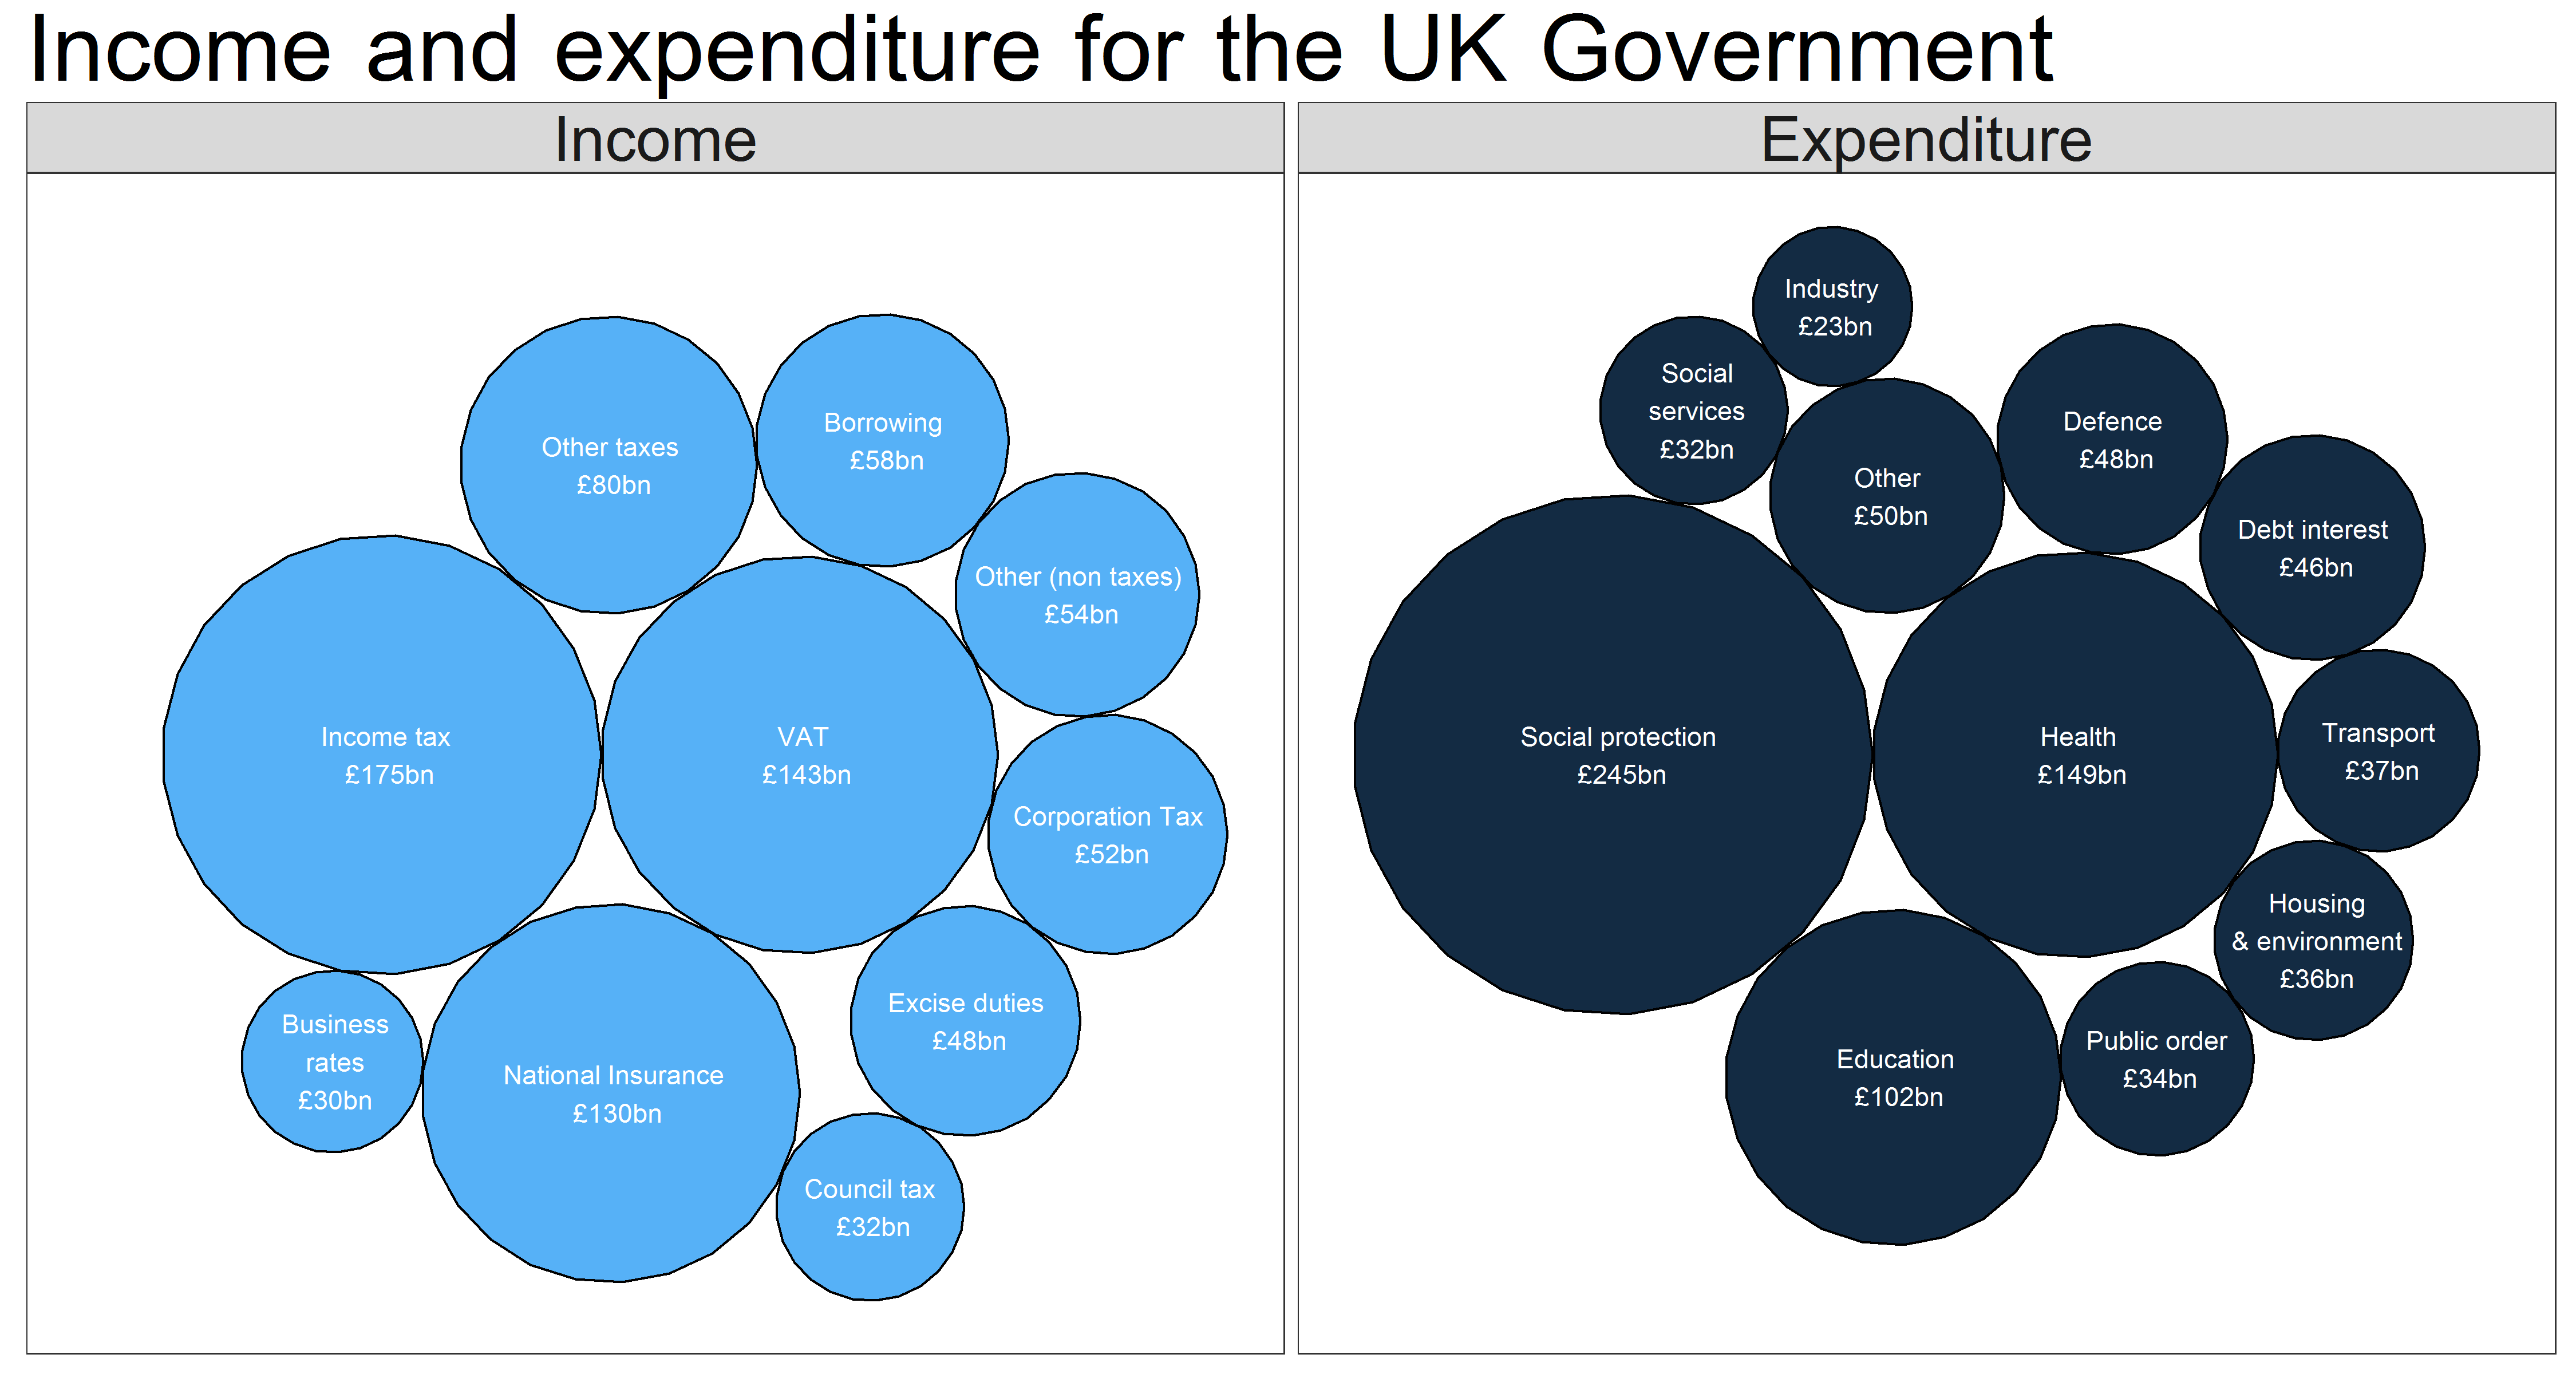
It’s time to branch out into a new area of data visualisation: proportion area plots. These plots use area to show proportion between different related values. A common type of proportional area plots are tree maps. We are going to be using the same principle but with circles. A common subject for area visualisation is … Read More “Spring Budget 2017: Circle visualisation” »
