Skip to content

R for Journalists

Unlock the power of R

  • What Is R?
  • R for Rob
  • GitHub
  • Twitter
  • Etsy

Comparing Donald Trump and Hillary Clinton’s Facebook pages during the US presidential election, 2016

Posted on September 10, 2017September 13, 2017 By Rob
Comparing Donald Trump and Hillary Clinton’s Facebook pages during the US presidential election, 2016
See

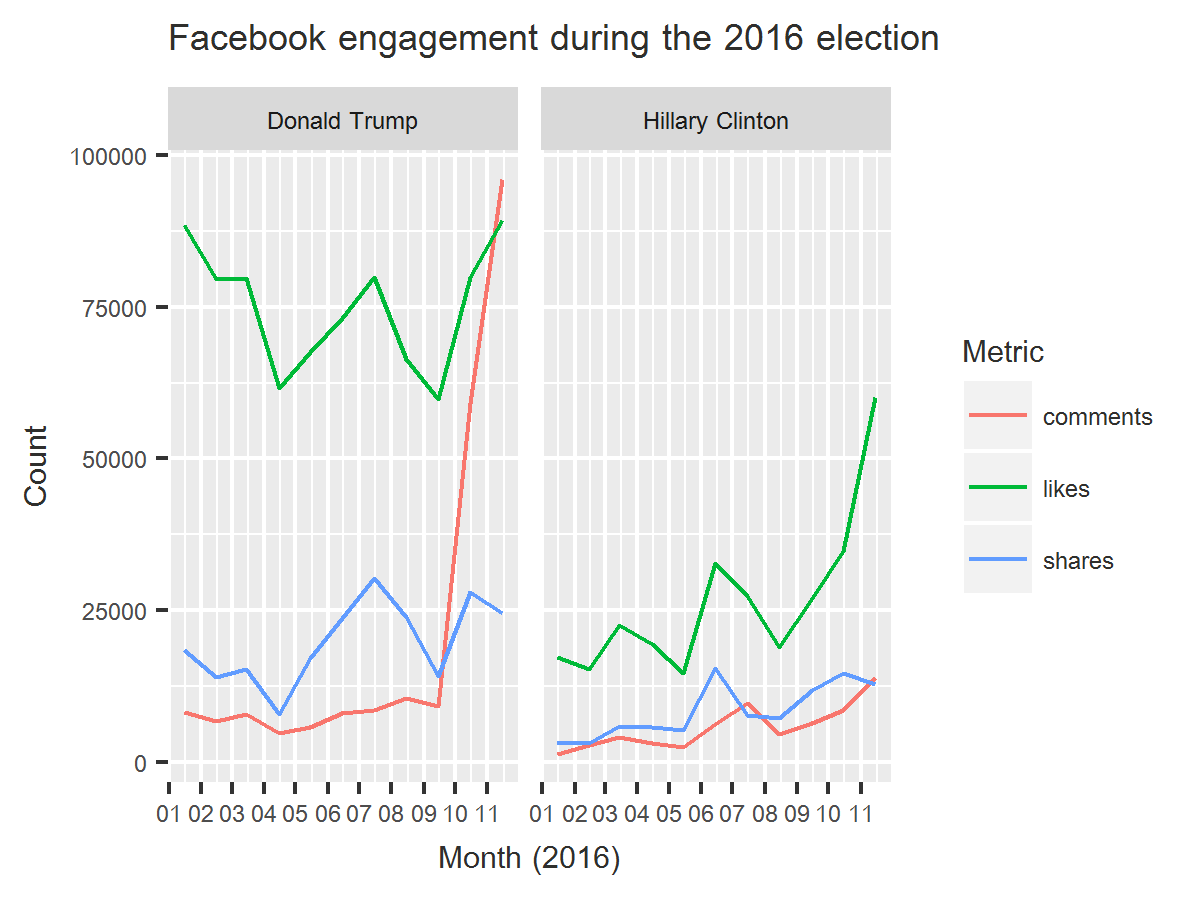
R has a lot of packages for users to analyse posts on social media. As an experiment in this field, I decided to start with the biggest one: Facebook. I decided to look at the Facebook activity of Donald Trump and Hillary Clinton during the 2016 presidential election in the United States. The winner may … Read More “Comparing Donald Trump and Hillary Clinton’s Facebook pages during the US presidential election, 2016” »

Calculating Distances in R: How Fast is Your Train?

Posted on August 26, 2017August 26, 2017 By Rob
Calculating Distances in R: How Fast is Your Train?
See

Earlier this month Marie Segger, Carlos Novoa and I had a major new project published about different rail speeds between cities around Britain. We compared the distances between train stations in Britain’s largest cities and found which areas were poorly-served by slow trains. Our project was picked up by a MP for Plymouth, a city … Read More “Calculating Distances in R: How Fast is Your Train?” »

Internal Migration Part III: Plotting Age Groups

Posted on August 17, 2017August 18, 2017 By Rob
Internal Migration Part III: Plotting Age Groups
See

Introduction In Part I we looked at overall internal migration local authority by local authority – are more people coming than going? In Part II we looked at where people are moving from and to around the country. Here in the final Part III we will look at the ages of people moving in and out. … Read More “Internal Migration Part III: Plotting Age Groups” »

Internal Migration, Part II: Homing in on individual authorities

Posted on August 9, 2017August 9, 2017 By Rob
Internal Migration, Part II: Homing in on individual authorities
See

In the first post we completed a hexagonal map showing internal migration at a glance around England and Wales in 2015/16. This map is very good for an overview of what’s going on around the country – is your area getting more people from or losing people to other parts of Britain? But it doesn’t … Read More “Internal Migration, Part II: Homing in on individual authorities” »

Internal Migration, Part I: Hexagonal maps of movement of people

Posted on July 20, 2017September 6, 2017 By Rob
Internal Migration, Part I: Hexagonal maps of movement of people
See

The Office for National Statistics published some of its most interesting data last week – internal migration. This is the movement of people within the UK of people who are already here, not counting people immigrating or emigrating from abroad. The ONS publishes its headline estimates and also the full underlying data, containing each possible … Read More “Internal Migration, Part I: Hexagonal maps of movement of people” »

Practice with For Loops: Calculating Mean Ages

Posted on May 28, 2017 By Rob
Practice with For Loops: Calculating Mean Ages
See

  At work I’ve been working on a project called Find My Seat, which is now live. You type in your postcode and it presents you with lots of useful data about the economy, healthcare, immigration and Brexit in your area. I pulled all the data used in the widget together. One task I had … Read More “Practice with For Loops: Calculating Mean Ages” »

Using R to make Freedom of Information requests

Posted on April 22, 2017 By Rob
Using R to make Freedom of Information requests
See

Like other departments the Ministry of Justice publishes spending data worth more than £25,000. It does this both for itself and for its executive agencies like the National Offender Management Service (NOMS) which runs the prison system. It does this monthly. A typical spreadsheet looks like this in R: dec <- read.csv(“noms-spend-december-2016.csv”) str(dec) ‘data.frame’: 14006 obs. … Read More “Using R to make Freedom of Information requests” »

How to Set Your Working Directory in RStudio on a PC

Posted on March 24, 2017 By Rob
Learn

This is a quick tip to avoid having to use the setwd() function to set your working directory all the time. Assuming you are working on a PC using RStudio, here is how to change your working directory to a R sub-folder. To do this, I made use of this guide. Step 1: Go to C:\Program Files\R\[your_version]\etc … Read More “How to Set Your Working Directory in RStudio on a PC” »

Cyclists Involved in Accidents Undertaking

Posted on February 15, 2017 By Rob
Cyclists Involved in Accidents Undertaking
See

Last week I wrote some stories about cyclists involved in accidents while undertaking. The stories generated a LOT of comment and debate – both far more and far more negative than I was expecting. I’ll address that in a moment, but first, here’s a useful exercise in how to get the Government’s STATS19 data and filter down to … Read More “Cyclists Involved in Accidents Undertaking” »

Overcrowding in prison

Posted on January 6, 2017January 8, 2017 By Rob
Overcrowding in prison
See

It’s been a rocky few months for the prison system in England and Wales. In December there was a riot at HMP Birmingham that lasted around 12 hours. Authorities had to send in Tornado teams to restore order. The bill for getting the prison back to normal, including moving inmates to other prisons and replacing locks, … Read More “Overcrowding in prison” »

Posts pagination

Previous 1 … 3 4 5 … 7 Next

Recent Posts

  • I’ve moved my blog over to Substack
  • How to plot a large rural area using Ordnance Survey data in R
  • Check the COVID-19 vaccination progress in your area
  • Let R tell you what to watch on Netflix
  • Sentiment analysis of Nineteen-Eighty-Four: how gloomy is George Orwell’s dystopian novel?

Archives

  • April 2022
  • April 2021
  • March 2021
  • February 2021
  • January 2021
  • December 2020
  • February 2020
  • December 2019
  • November 2019
  • October 2019
  • April 2018
  • March 2018
  • January 2018
  • December 2017
  • November 2017
  • October 2017
  • September 2017
  • August 2017
  • July 2017
  • May 2017
  • April 2017
  • March 2017
  • February 2017
  • January 2017
  • December 2016
  • November 2016
  • October 2016
  • September 2016

Categories

  • Geospatial data
  • Landmark Atlas
  • Learn
  • See
  • Seen Elsewhere
  • Site
  • Uncategorized

Copyright © 2025 R for Journalists.

Theme: Oceanly by ScriptsTown


Loading Comments...