Skip to content

R for Journalists

Unlock the power of R

  • What Is R?
  • R for Rob
  • GitHub
  • Twitter
  • Etsy

My First Shiny App Part II: The Shiny code itself

Posted on January 21, 2018 By Rob
See

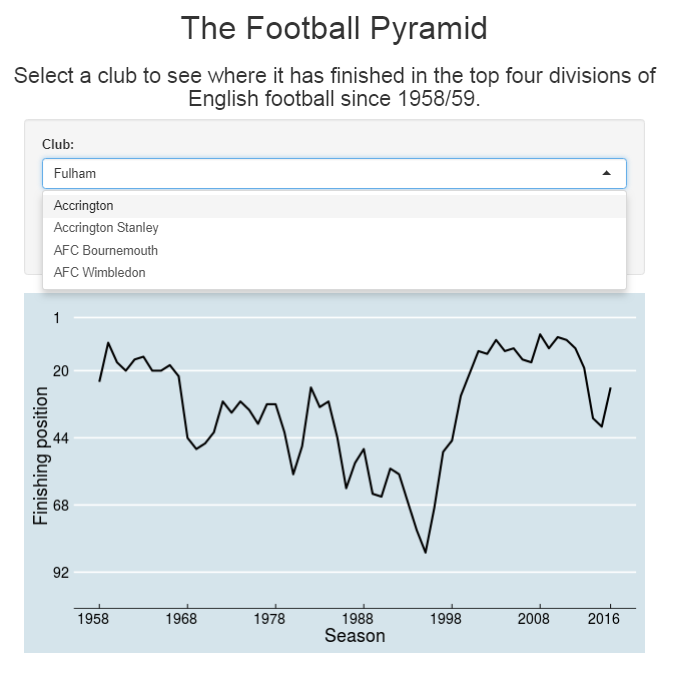
Recap In the last post we got to the stage where we had the data for each club’s league positions since 1958/59 in a Google sheet. The next step is to visualise this data in a Shiny app. Shiny lets you create visualisations that your users can interact with, and they have slightly different code … Read More “My First Shiny App Part II: The Shiny code itself” »

2017 Blog Stats

Posted on January 1, 2018 By Rob
Site

Happy New Year to all my readers! Blog stats My last post took the blog through past 4,000 page views for 2017, up 41 per cent on 2016. I only started R for Journalists in October 2016, so it’s not an entirely fair comparison for a full year of 2017. However, I put this website … Read More “2017 Blog Stats” »

My First Shiny App: See Where Your Team Ranks in the Football Pyramid

Posted on December 31, 2017January 22, 2020 By Rob
My First Shiny App: See Where Your Team Ranks in the Football Pyramid
See

Here is my first Shiny app! Shiny lets you create interactive visualisations in R. It’s a big step forward from the static visualisations we have done thus far. R has a fairly steep learning curve at the beginning. It took me several months and a DataCamp course before I began to know what I was … Read More “My First Shiny App: See Where Your Team Ranks in the Football Pyramid” »

How to Use googlesheets to Connect R to Google Sheets

Posted on December 12, 2017 By Rob
How to Use googlesheets to Connect R to Google Sheets
Learn

Often I use R to handle large datasets, analyse the data and filter out the data I don’t need. When all this is done, I usually use write.csv() to print my data off and reopen it in Google Sheets. My workflow would look something like this: full_data <- read.csv(“some_dataset.csv”) #R analysis ending up with relevant_data write.csv(relevant_data, … Read More “How to Use googlesheets to Connect R to Google Sheets” »

R for Absolute Beginners

Posted on December 11, 2017 By Rob
Learn

  On Tuesday I gave a workshop at the Data Journalism UK conference, run by Paul Bradshaw. This was the worked example for absolute beginners that we went through. If you’ve never looked at R before and want to run some R code, load up this page , copy the following in step by step … Read More “R for Absolute Beginners” »

Road accidents in November

Posted on November 26, 2017November 26, 2017 By Rob
Road accidents in November
Uncategorized

Recently the British Department for Transport published its latest STATS19 data for the year 2016. We’ve looked at this data before. To recap, each row of the STATS19 data is a traffic accident that caused injury or death, identified by a unique Accident Index. It’s an extremely detailed dataset containing fields such as the latitude … Read More “Road accidents in November” »

Vandalism Causing Train Delays

Posted on November 19, 2017 By Rob
Vandalism Causing Train Delays
See

Over the past two weeks I’ve been looking at Network Rail’s delays data. The data tells us how many delays there have been to trains thanks to all kinds of problems that affect the railways, from natural causes such as that seasonal favourite ‘leaves on the line‘ to human causes such as vandalism. There are … Read More “Vandalism Causing Train Delays” »

The Losses in the Final Year of WW1

Posted on November 11, 2017 By Rob
The Losses in the Final Year of WW1
See

Back in August 2014, around the 100th anniversary of the outbreak of the First World War, the Data Unit published our analysis of the Commonwealth War Graves Commission‘s records of fallen soldiers, airmen, sailors and other servicemen and women who gave their lives during the next four years. As the 100th anniversaries have come and … Read More “The Losses in the Final Year of WW1” »

Scraping in R: Access to mortgage petition

Posted on October 25, 2017 By Rob 1 Comment on Scraping in R: Access to mortgage petition
Scraping in R: Access to mortgage petition
See

Over the past few years a good source of data has been Parliament’s petitions website. Anyone can start petitions or sign them. MPs have to consider the ones that get to 100,000 signatures for debates. The most popular petitions often end up leading the news cycle, such as the petition arguing for a second EU … Read More “Scraping in R: Access to mortgage petition” »

Spring Budget 2017: Circle visualisation

Posted on October 1, 2017 By Rob
Spring Budget 2017: Circle visualisation
See

It’s time to branch out into a new area of data visualisation: proportion area plots. These plots use area to show proportion between different related values. A common type of proportional area plots are tree maps. We are going to be using the same principle but with circles. A common subject for area visualisation is … Read More “Spring Budget 2017: Circle visualisation” »

Posts pagination

Previous 1 2 3 4 … 7 Next

Recent Posts

  • I’ve moved my blog over to Substack
  • How to plot a large rural area using Ordnance Survey data in R
  • Check the COVID-19 vaccination progress in your area
  • Let R tell you what to watch on Netflix
  • Sentiment analysis of Nineteen-Eighty-Four: how gloomy is George Orwell’s dystopian novel?

Archives

  • April 2022
  • April 2021
  • March 2021
  • February 2021
  • January 2021
  • December 2020
  • February 2020
  • December 2019
  • November 2019
  • October 2019
  • April 2018
  • March 2018
  • January 2018
  • December 2017
  • November 2017
  • October 2017
  • September 2017
  • August 2017
  • July 2017
  • May 2017
  • April 2017
  • March 2017
  • February 2017
  • January 2017
  • December 2016
  • November 2016
  • October 2016
  • September 2016

Categories

  • Geospatial data
  • Landmark Atlas
  • Learn
  • See
  • Seen Elsewhere
  • Site
  • Uncategorized

Copyright © 2025 R for Journalists.

Theme: Oceanly by ScriptsTown


Loading Comments...