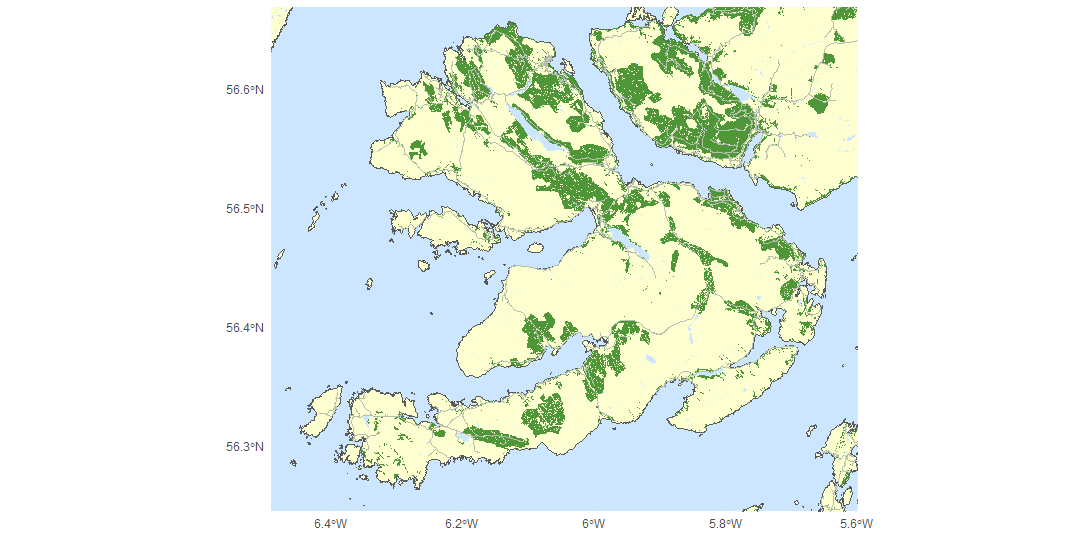
Geospatial data, Landmark Atlas, Learn
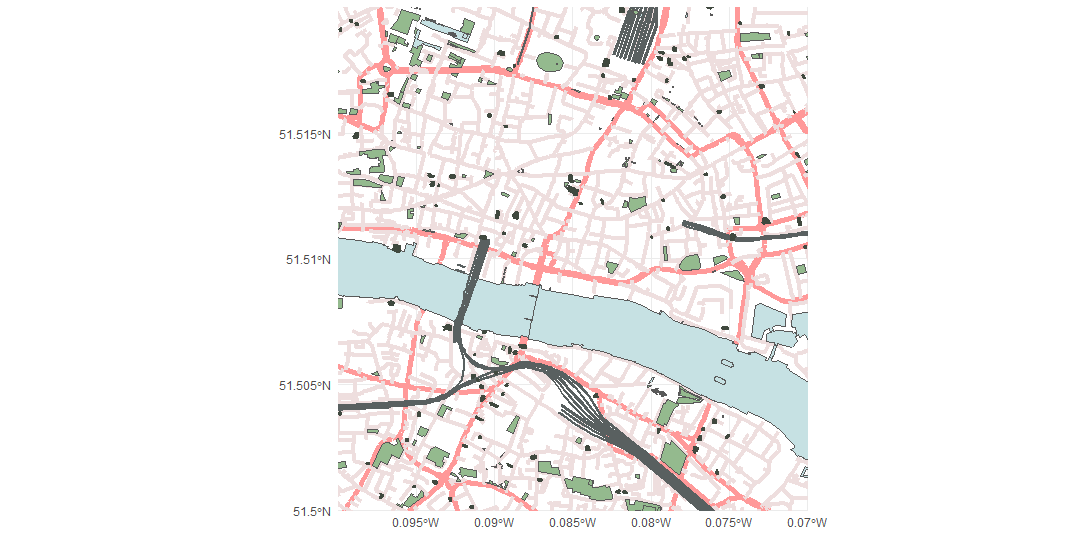
How to use Ordnance Survey data for a base map in R.
Unlock the power of R
How to use Ordnance Survey data for a base map in R.
How to build an app that recommends shows you might like on Netflix.
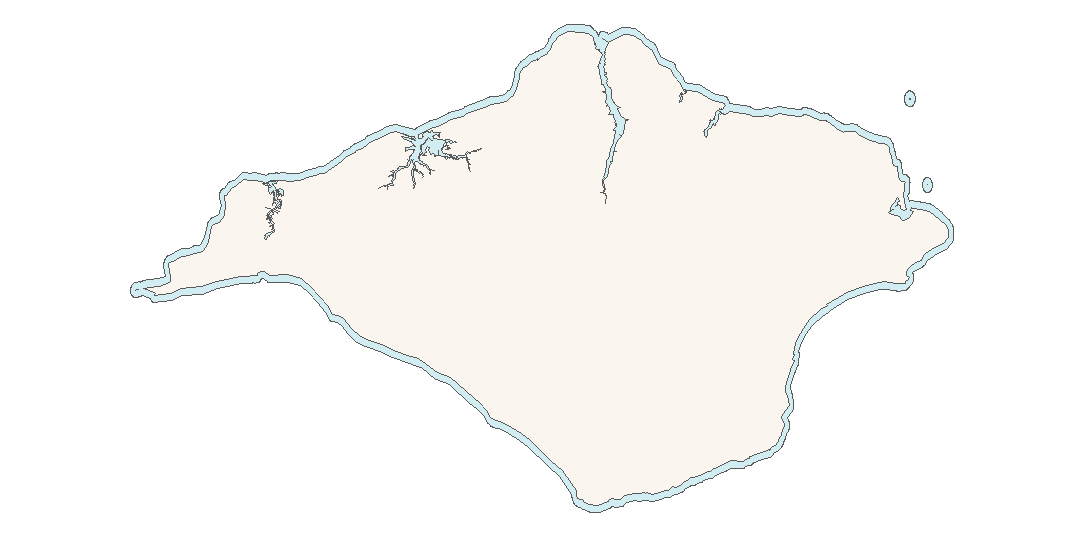
An introduction to Open Street Map and how to access its data through R.
Five more useful functions from the sf package.
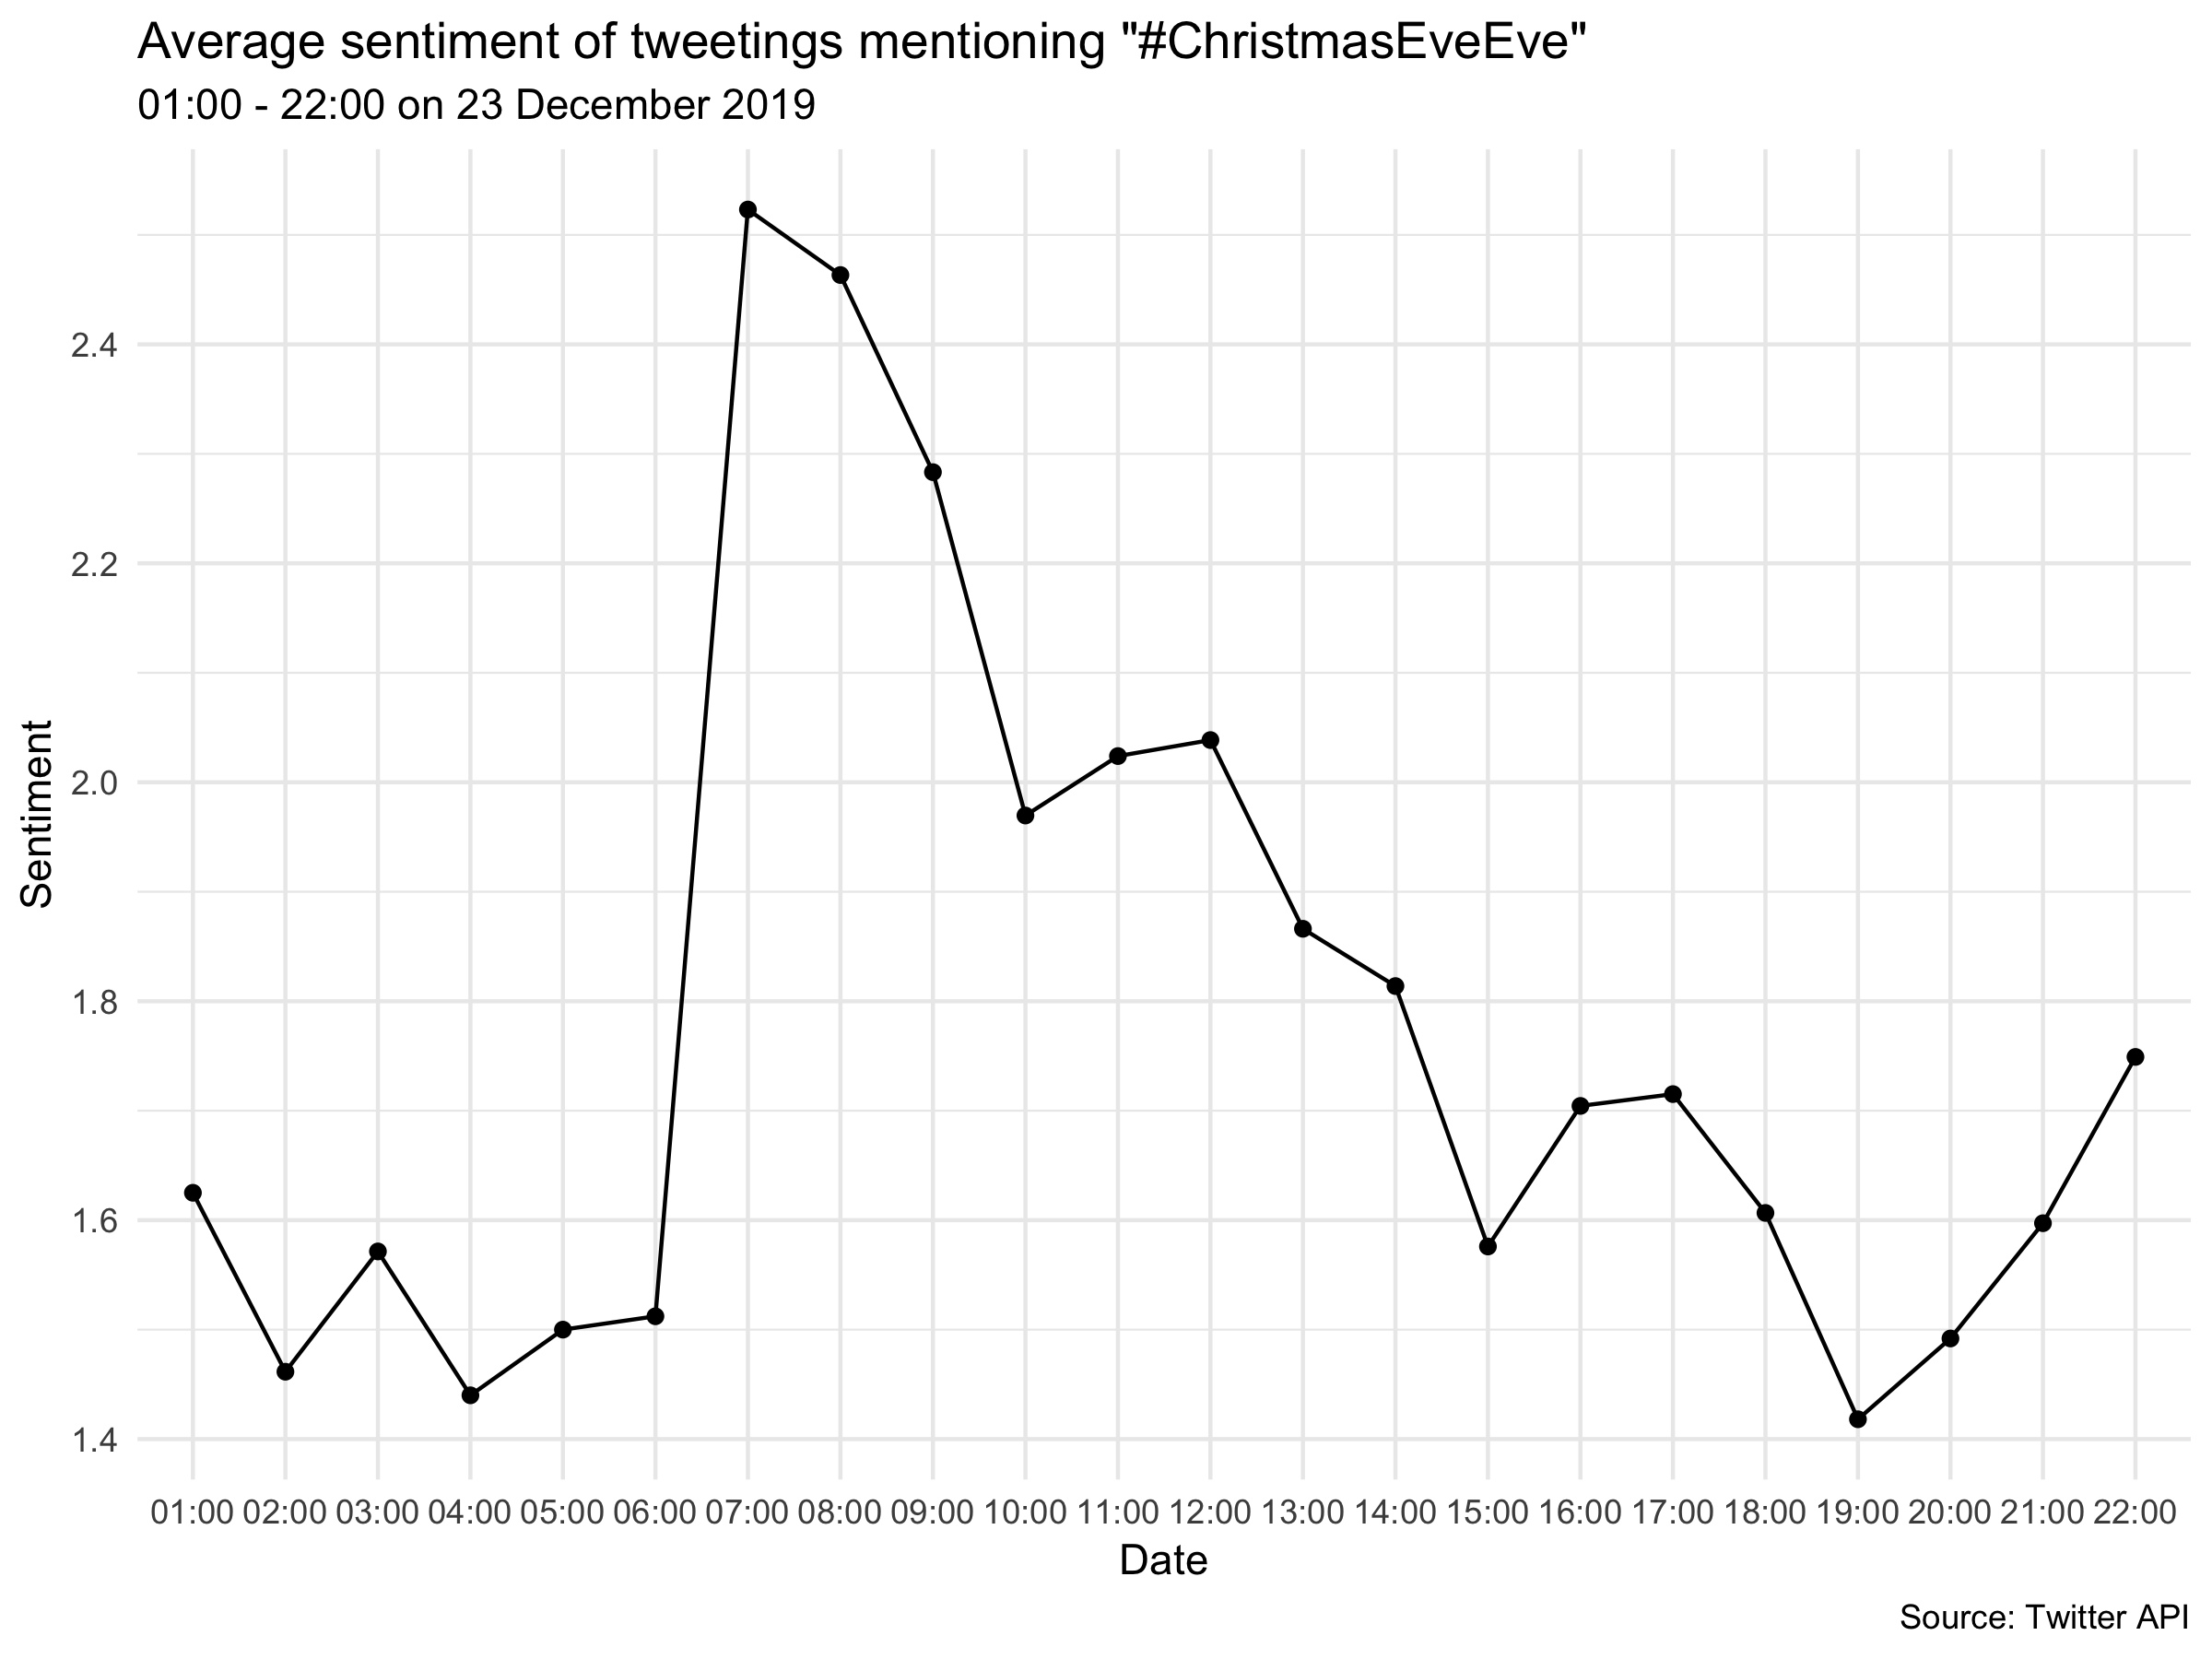
Investigate the tone of tweets from Twitter using the API.
A dive into machine learning in R
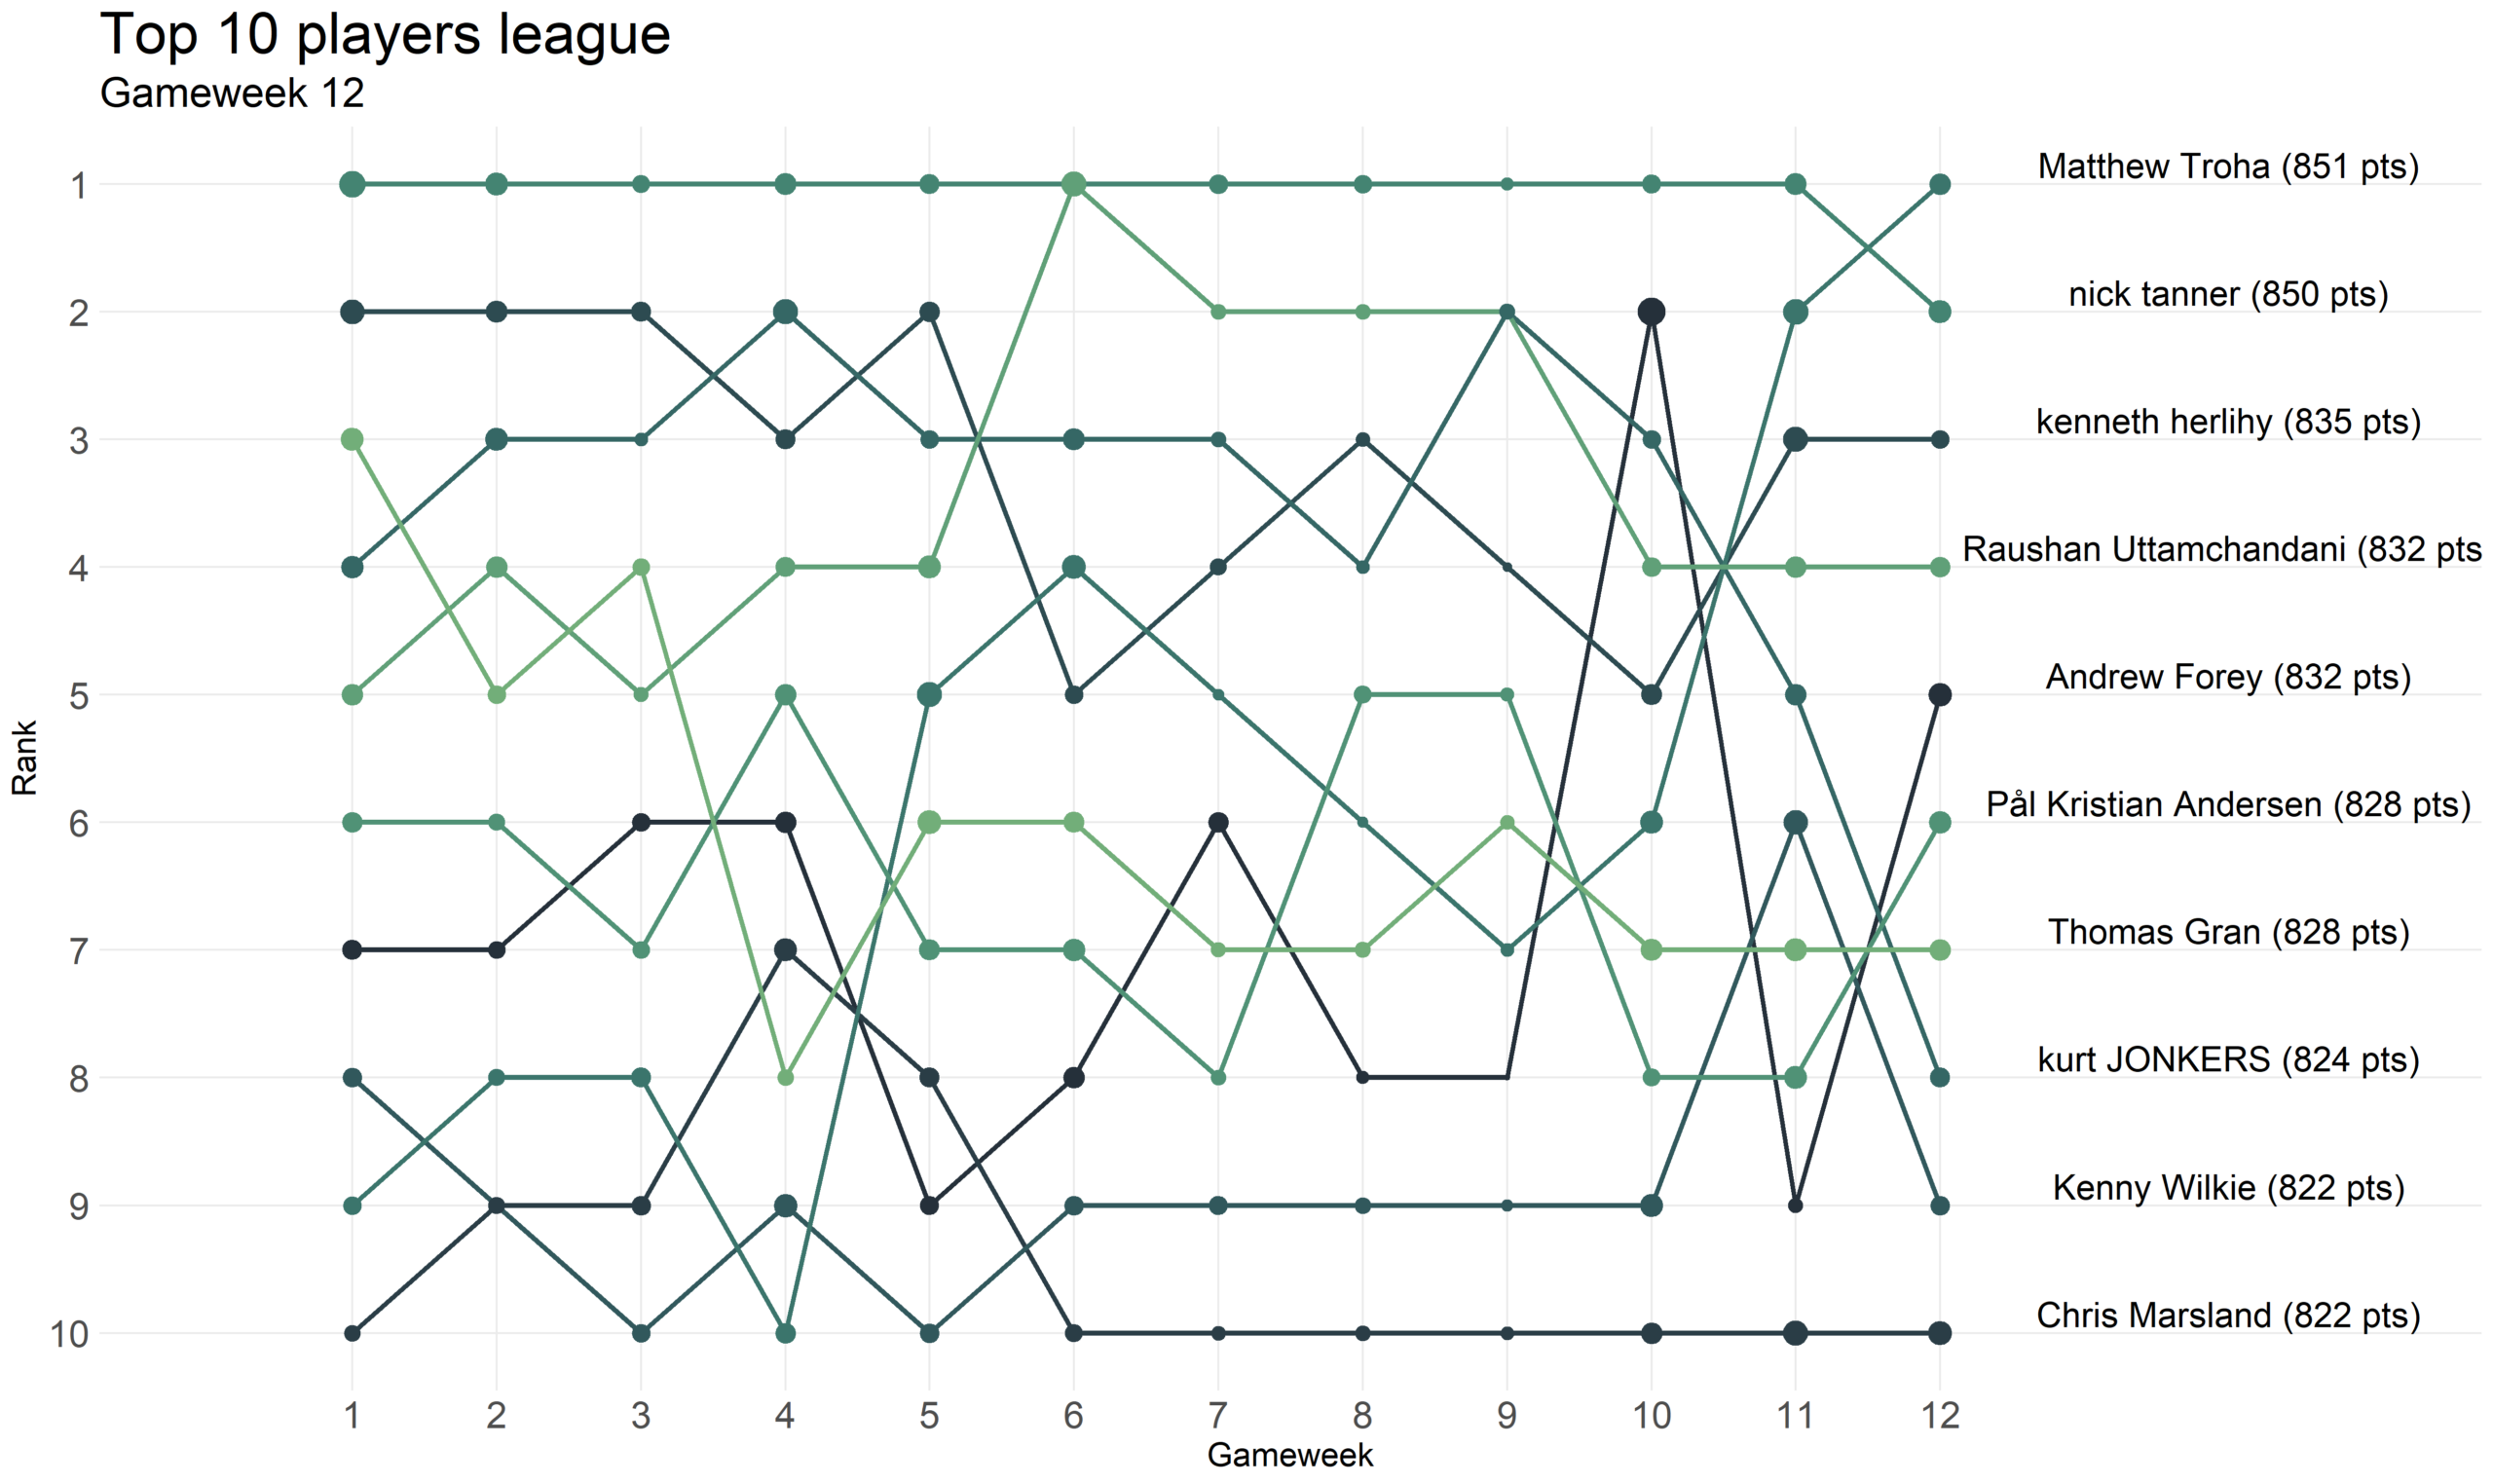
Track the joy and the pain of FPL using R.
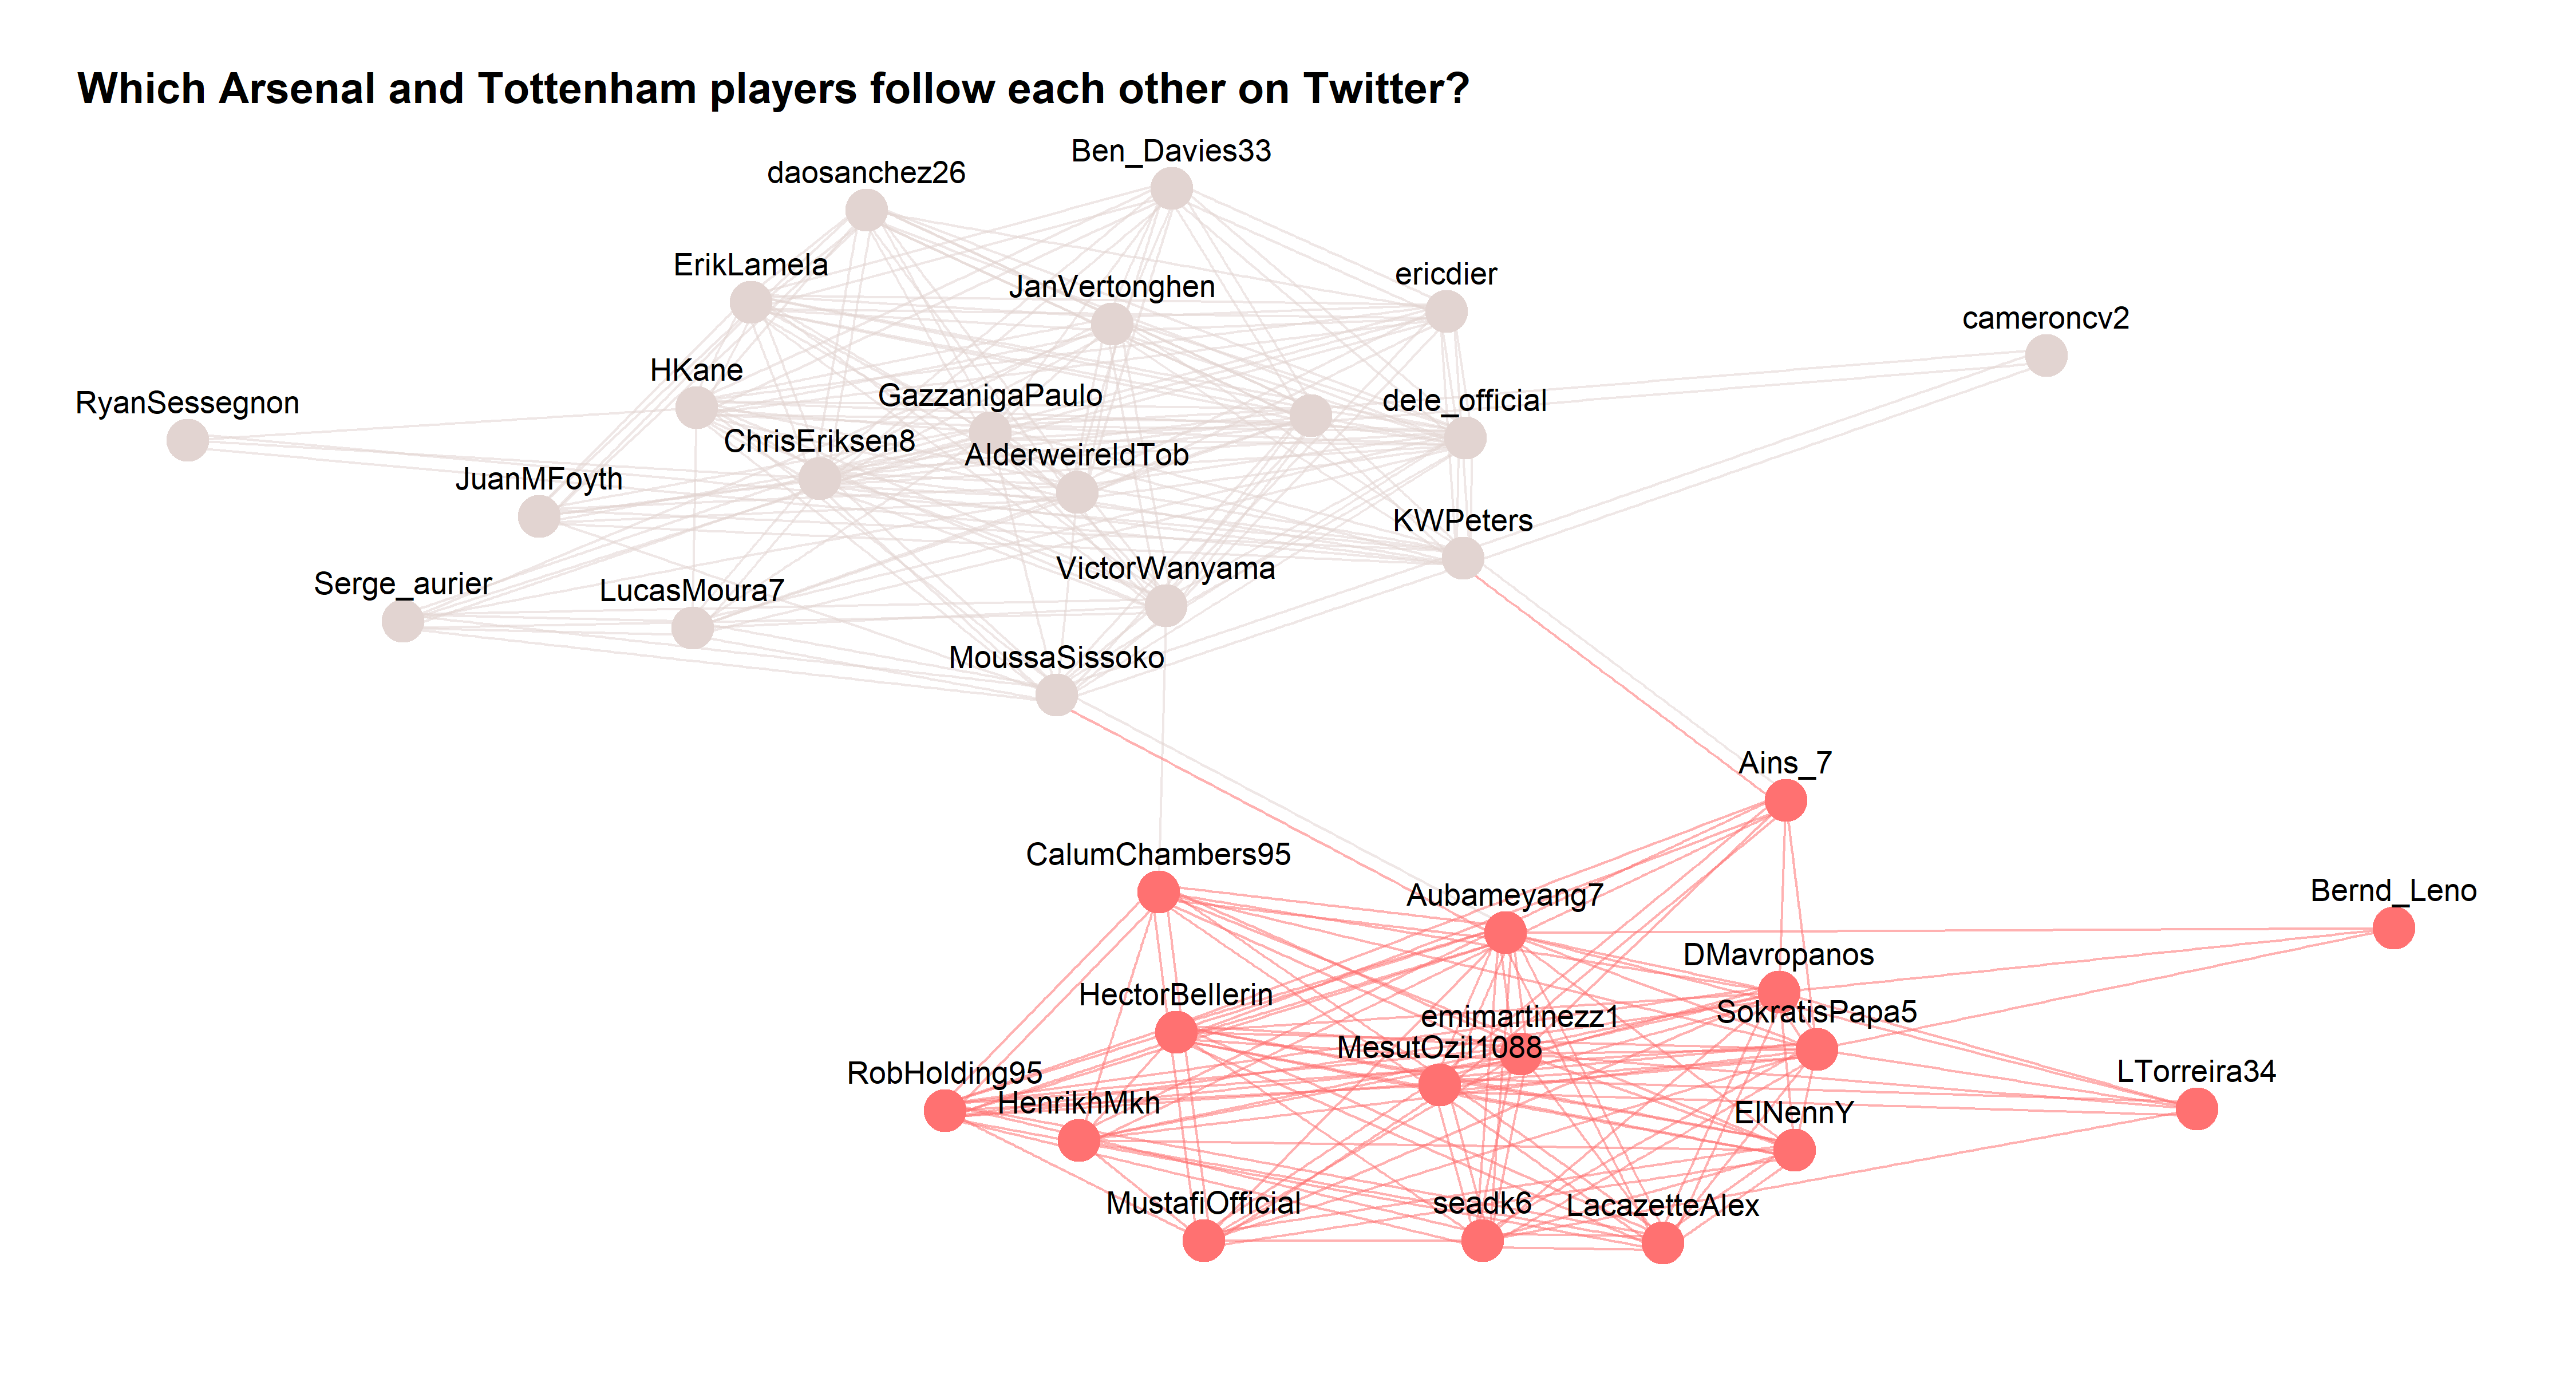
Do any of these footballing rivals follow each other on social media?
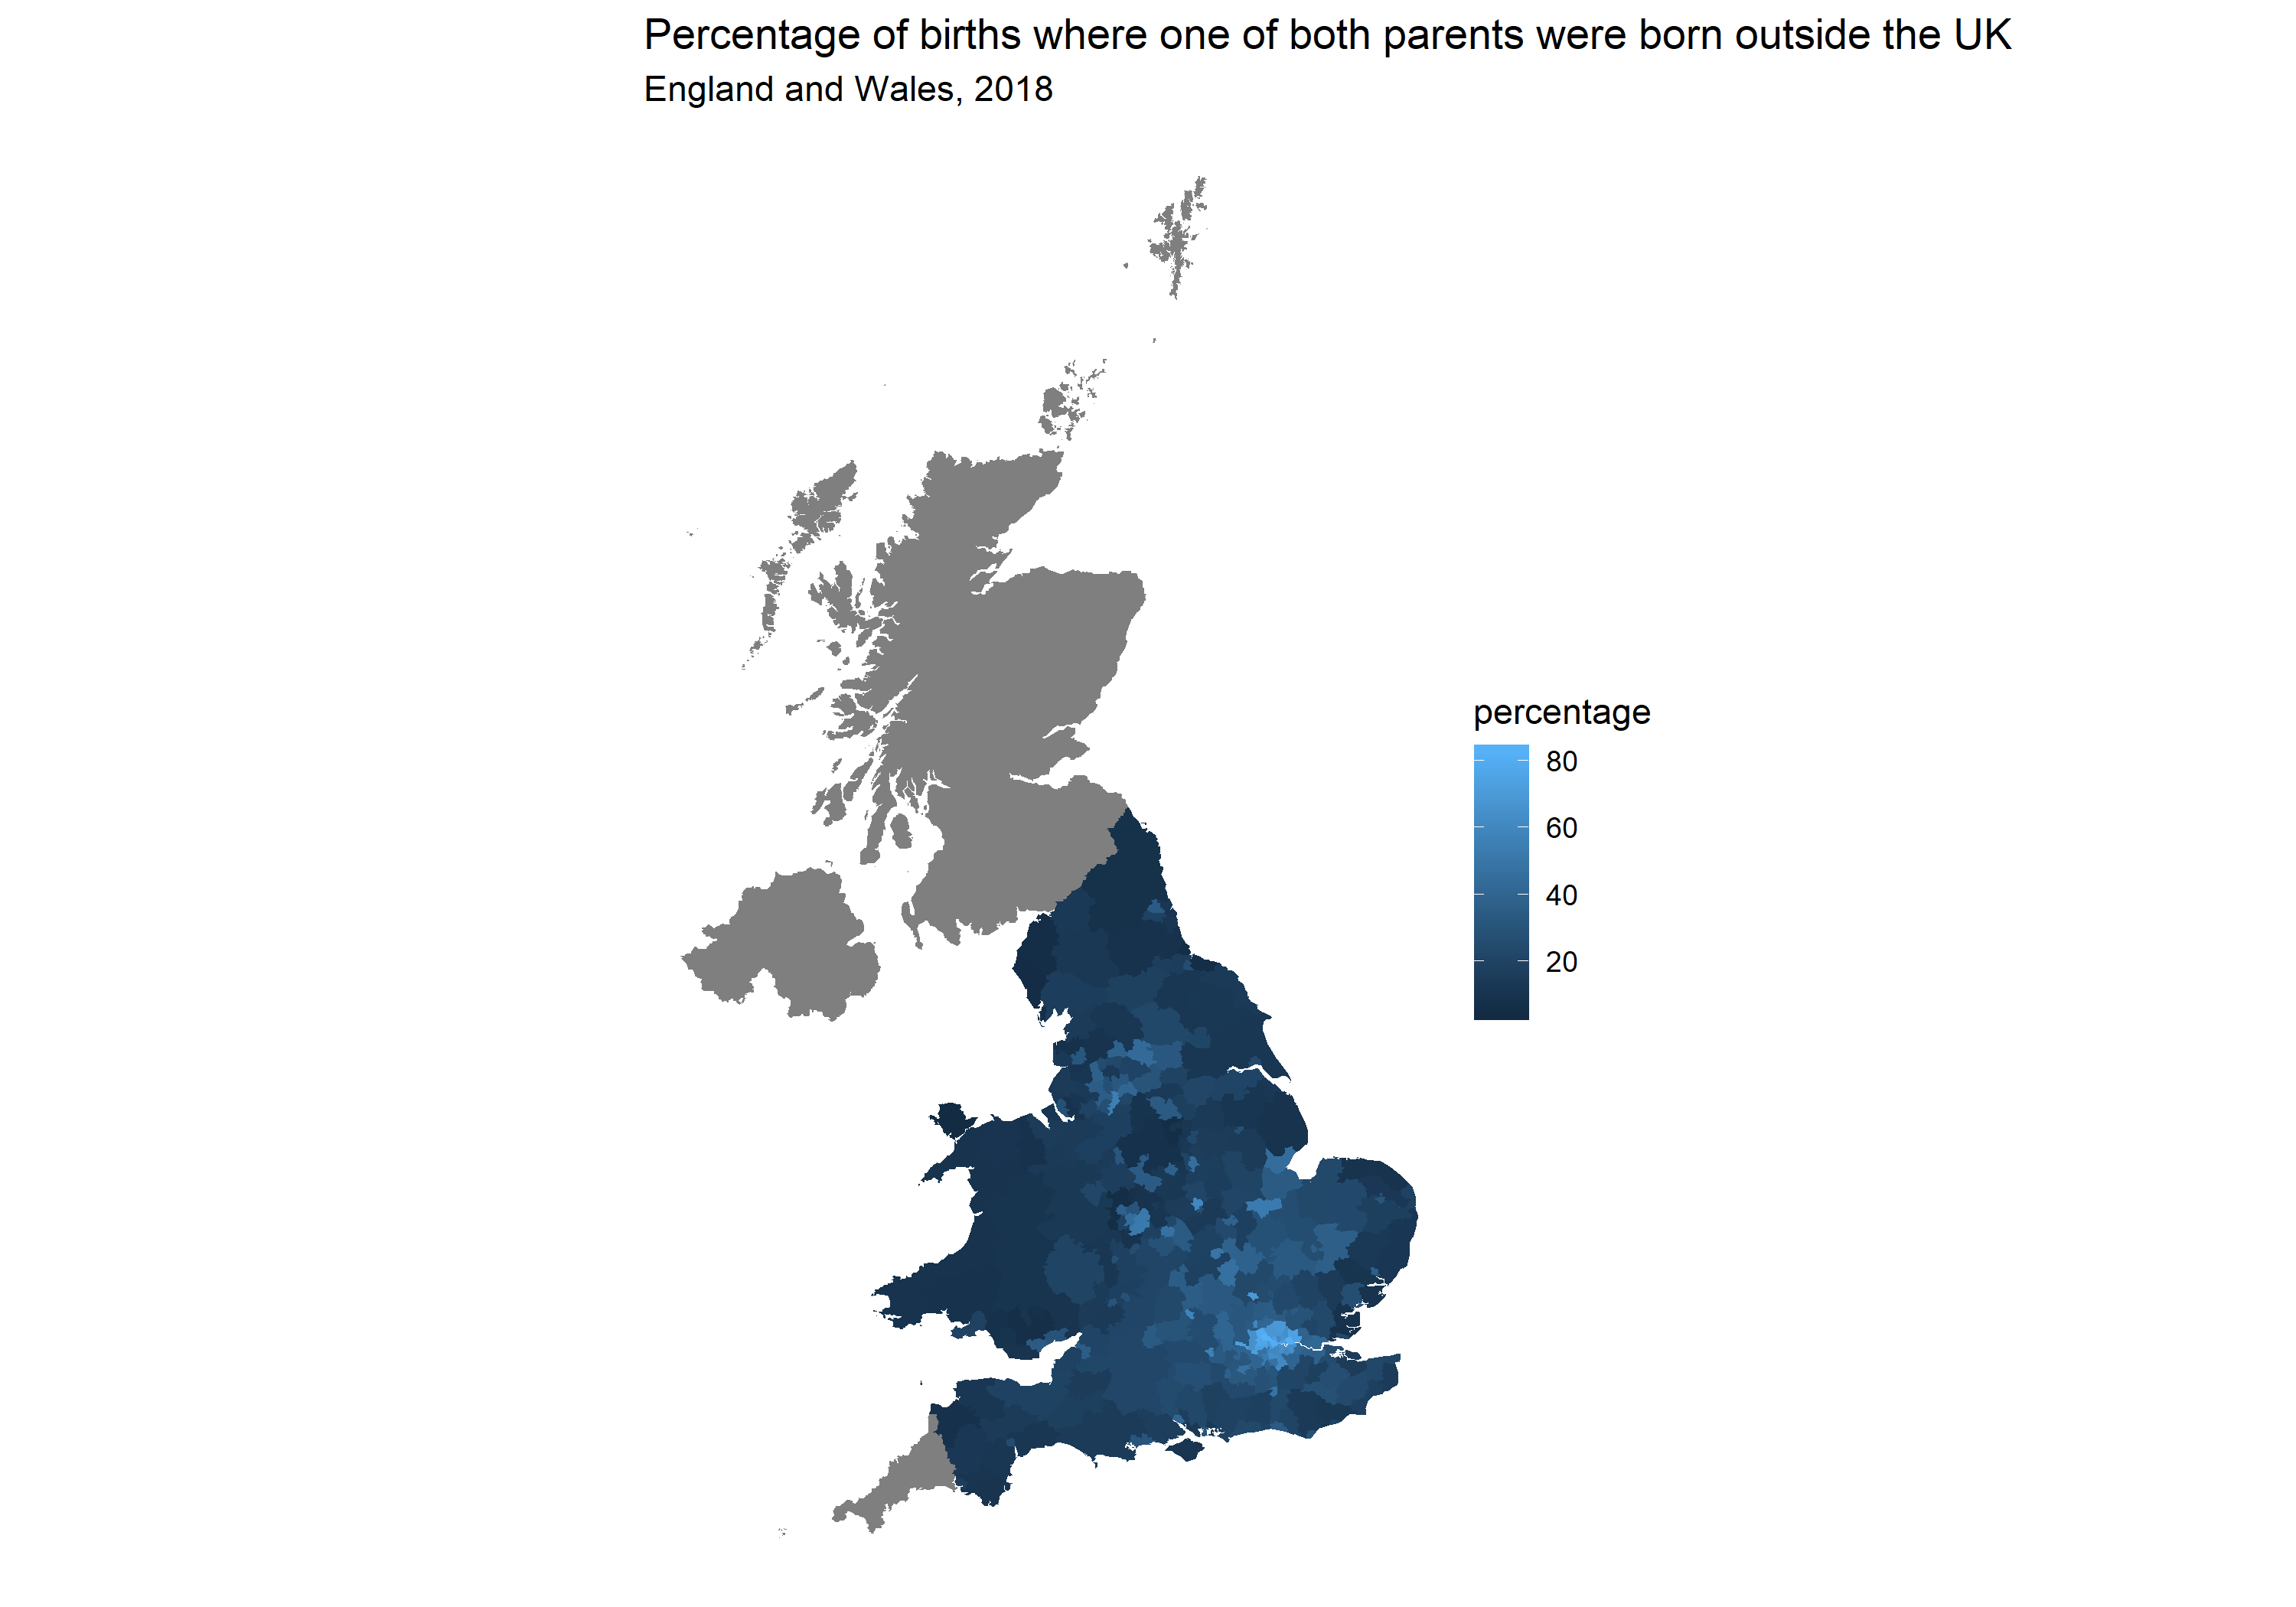
Particularly useful in the time of COVID-19 – how visualise different local rates around the UK.
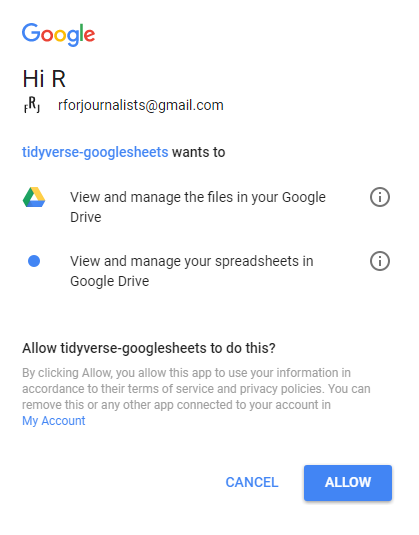
Often I use R to handle large datasets, analyse the data and filter out the data I don’t need. When all this is done, I usually use write.csv() to print my data off and reopen it in Google Sheets. My workflow would look something like this: full_data <- read.csv(“some_dataset.csv”) #R analysis ending up with relevant_data write.csv(relevant_data, … Read More “How to Use googlesheets to Connect R to Google Sheets” »