Author’s note: if you like this post, you might like Landmark Atlas. This is my new blog where I tell stories about Britain’s history, culture and geography through maps.
This autumn I’ve opened an Etsy shop called Landmark Atlas. I sell antique-style maps created with R. Here they are:
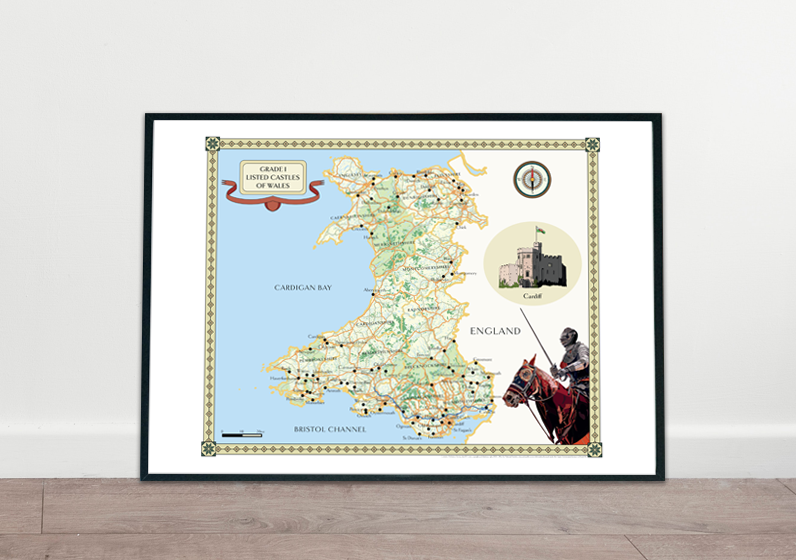
Grade I listed Castles of Wales

This map plots 75 Grade I listed castles in Wales, as available on Lle, the Welsh Government’s geography portal.
Their Grade I listing means they are considered among the finest in the country renowned for the quality and quantity of its castles.
I plotted them on a base map containing data from the Office for National Statistics and the Ordnance Survey’s Open Data, containing features such as rivers, main roads, forests and National Parks.
Here are the Etsy links to the printed map and the digital download.
Category A listed castles of Scotland

This map focuses on the finest castles of the Highlands of Scotland.
It features drawings of the dramatic and picturesque Eilean Donan castle, where three lochs meet in the west and Dunrobin, perched overlooking the Dornoch Firth with its French chateau style.
Here are the Etsy links to the printed product and the digital download.
What about the drawings?
You will notice that the maps contain drawings of certain castles. This is where the ‘Landmark’ part of Landmark Atlas comes from.
I drew these on Adobe Illustrator. I used photographs of the castles as source material from the wonderful website Unsplash, which has more than two million photographs in the public domain. This means you can adapt them however you like, including commercially.

What is the story behind Landmark Atlas?
I initially started experimenting with Open Street Map’s R package.
I knew of various sources of open data from my work and went about seeing what maps I could draw from them.
I looked around at what was already available and saw that there were plenty of minimalist maps of London, Manchester, Bristol and other places on Etsy.
I’d started drawing again a year or so ago, picking up an old hobby I’d enjoyed as a boy. Initially I wanted to combine my drawings and the maps but then I realised this would take far too long. This led me towards Illustrator. The drawings still take some time but I’ve picked up some tricks along the way to speed them along.
It was from here that I discovered Ordnance Survey’s Open Data portal and began to move away from Open Street Map. After some more work I was finally ready to open my Etsy shop!
What’s next
As well as working on more maps, I’m going to publish some posts outlining some things I learned through this process. An outline of those posts is below:
- Five useful spatial functions from the sf R package
- Five more useful spatial functions from the sf R package
- How to access Open Street Map in R
- How to plot a large rural area using Ordnance Survey data in R