In my last post I introduced some useful functions from the sf package in R for working with geospatial data. Take a look at it if you haven’t already before looking at these additional ones.
You can find the code on GitHub to practise these functions.
1. st_buffer()
This function is a niche but very useful one. It allows you to draw an expanded polygon around an original.
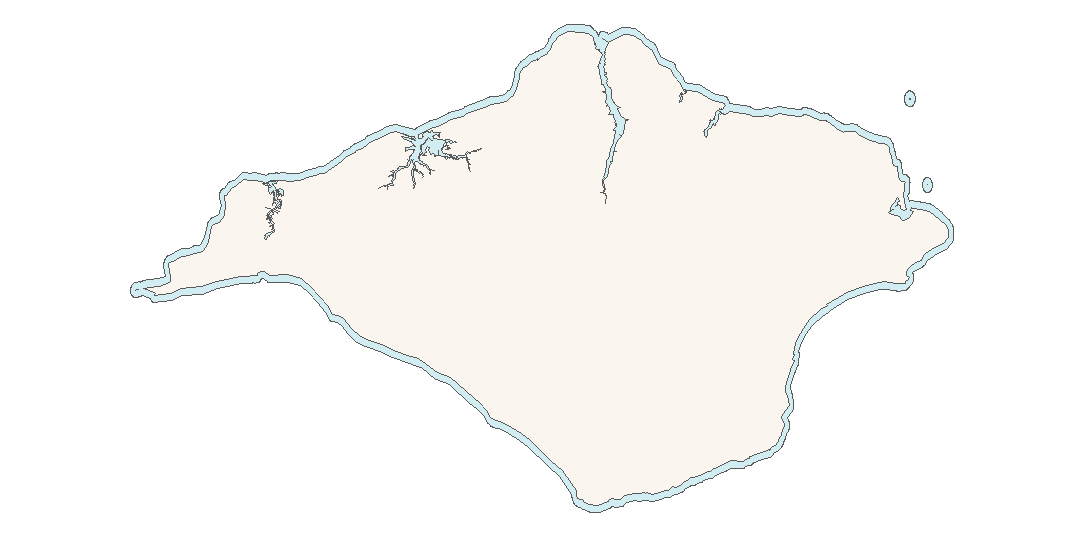
This is a neat trick to add ‘territorial waters’ around land where it meets the sea. On old maps like the one pictured you often see a dark streak to denote the inner waters surrounding land. You can achieve the same effect with this function.

Here’s an example with the Isle of Wight:
#see part 1 for more instructions on how to read_sfconstituencies <- read_sf('your_working_directory/constituencies')
constituencies_wgs <- st_transform(constituencies, 4326)
iow <- constituencies_wgs[constituencies_wgs$pcon16nm == 'Isle of Wight',]
iow_buffer <- st_buffer(iow, dist = 0.003)
ggplot() + geom_sf(data = iow_buffer, fill = '#D1EDF2') +
geom_sf(data = iow, fill = '#FAF5EF') + theme_void()

2. st_difference()
If two polygons overlap then this function allows you to remove the overlapping areas from two polygons. If you imagine a Venn diagram – the part in the middle where the circles overlap is erased, leaving the parts that don’t overlap.
In our above example iow_buffer is plotted first with iow on top of it. The light purple of iow obscures most of the blue iow_buffer apart from the bit that juts out into the sea. But it is still there, invisible. In our example st_difference() removes it and keeps just the buffer section that doesn’t overlap.
iow_buffer_isolated <- st_difference(iow_buffer, iow)
ggplot() + geom_sf(data = iow_buffer_isolated, fill = '#D1EDF2') + theme_void()

3. st_centroid()
This function finds a centroid in a polygon.
iow_centroid <- st_centroid(iow)
 ggplot() + geom_sf(data = iow, fill = '#FAF5EF') + geom_sf(data = iow_centroid, size = 4) + theme_void()

4. st_distance()
This function finds the distance between two points.
Using this code we can see that the centroid of Portsmouth South is 20.5km away from the centroid of the Isle of Wight.
library(lwgeom)
portsmouth <- constituencies_wgs[constituencies_wgs$pcon16nm == 'Portsmouth South',]
portsmouth_centroid <- st_centroid(portsmouth)
st_distance(portsmouth_centroid, iow_centroid)
Units: [m]
[,1]
[1,] 20538.91
5. st_area()
This function finds the area of a polygon.
   st_area(iow)
   380450744 [m^2]
This gives an area of 380.4 sq km. This is very similar to the area given on Wikipedia’s page for the Isle of Wight.
That just about covers my use of the sf package so far. I hope you find these functions practical for your work!