Arsenal and Tottenham Hotspur may be fierce rivals on the pitch, but are things a more friendly affair on social media?
In this post you will learn how to connect to the Twitter API and run network analysis on Twitter followers.
We will need the tidygraph package. Here is an introduction from the author.
I’m also indebted to this super analysis of Game of Thrones characters and how they link together.
Here is the full code (you will need a Twitter account):
library(rtweet)
library(tidyverse)
library(tidygraph)
library(ggraph)

api_key <- "###"
api_secret_key <- "###"
access_token <- "###"
access_token_secret <- "###"

authenticate via web browser
token <- create_token(
app = "YOUR_APP",
consumer_key = api_key,
consumer_secret = api_secret_key,
access_token = access_token,
access_secret = access_token_secret)

#arsenal players
arsenal <- lists_members(slug = 'arsenal-players', owner_user = 'arsenal', token = token)
arsenal_short <- data.frame(following = arsenal$screen_name, user_id = arsenal$user_id, team = '2')

#spurs players
spurs <- lists_members(slug = 'tottenham-hotspur-players', owner_user = 'spursofficial', token = token)
spurs_short <- data.frame(following = spurs$screen_name, user_id = spurs$user_id, team = '1')

#people Arsenal players are following
arsenal_fol_all <- lapply(arsenal$screen_name, get_friends, token = token)
arsenal_fol_all <- bind_rows(arsenal_fol_all)
#get extra
arsenal_fol_extra <- lapply(arsenal$screen_name[16], get_friends, token = token)
arsenal_fol_extra <- bind_rows(arsenal_fol_extra)
arsenal_fol_all <- rbind(arsenal_fol_all,arsenal_fol_extra)

#people Spurs players are following
spurs_fol_all <- lapply(spurs$screen_name, get_friends, token = token)
spurs_fol_all <- bind_rows(spurs_fol_all)
#get extra
spurs_fol_extra <- lapply(spurs$screen_name[16:20], get_friends, token = token)
spurs_fol_extra <- bind_rows(spurs_fol_extra)
spurs_fol_all <- rbind(spurs_fol_all,spurs_fol_extra)

#combined
fol <- rbind(arsenal_fol_all, spurs_fol_all)
short <- rbind(arsenal_short, spurs_short)
fol_only <- merge(fol, short, by = 'user_id')

graph_data <- as_tbl_graph(fol_only[,2:4]) %>%
  tidygraph::mutate(group = group_infomap())

graph_data %>% ggraph(layout = 'kk')  +
  geom_edge_parallel(arrow = NULL, aes(color = factor(team), alpha = 0.4)) +
  geom_node_point(size = 8, aes(color = factor(group))) +
  geom_node_text(aes(label = name, size = 3), vjust = -1.2) +
  ggtitle('Which Arsenal and Tottenham players follow each other on Twitter?')  +
  theme_graph() + theme(legend.position = 'none') +
  scale_color_manual(values = c('#E2D4D1','#FF7171')) +
  scale_edge_color_manual(values = c('#E2D4D1','#FF7171'))

ggsave('arsenal-spurs.png',last_plot(),height = 8, width = 15)
Step 1, get your credentials set up:
library(rtweet)
library(tidyverse)
library(tidygraph)
library(ggraph)

api_key <- "###"
api_secret_key <- "###"
access_token <- "###"
access_token_secret <- "###"

token <- create_token(
app = "YOUR_APP",
consumer_key = api_key,
consumer_secret = api_secret_key,
access_token = access_token,
access_secret = access_token_secret)
Sign in to your Twitter account and go to Twitter apps to create an app. I’m not sure if Twitter allows you to do this immediately or whether it verifies apps at the moment.
Once that’s done, click on your app’s Details –> Keys and tokens. Copy the four keys and tokens into your R environment.
Be careful not to share these with anyone! Anyone with access to these has more or less complete control over your account, including the ability to post tweets and access your direct messages.
For more advanced users, if you are using Heroku to create Twitter apps, consider using environment variables to store your keys so potential hackers can’t find your keys via the logs of your app.
I used token = token during my code because RStudio was confusing it with a previous app I had set up. If you just have one set up this is redundant.
Step 2, get the lists of players:
#arsenal players
arsenal <- lists_members(slug = 'arsenal-players', owner_user = 'arsenal', token = token)
arsenal_short <- data.frame(following = arsenal$screen_name, user_id = arsenal$user_id, team = '2')

#spurs players
spurs <- lists_members(slug = 'tottenham-hotspur-players', owner_user = 'spursofficial', token = token)
spurs_short <- data.frame(following = spurs$screen_name, user_id = spurs$user_id, team = '1')
Both Arsenal and Spurs‘ official Twitter accounts keep lists of their respective players. We can use list_members to get the data on these accounts. Rtweet collects a lot of data about accounts, so we’re going to cut out everything but the user id and the twitter account handle, as well as adding a ‘team’ dimension with a numeric code for each team.
Step 3: get the accounts the players follow:
#people Arsenal players are following
arsenal_fol_all <- lapply(arsenal$screen_name, get_friends, token = token)
arsenal_fol_all <- bind_rows(arsenal_fol_all)

#get extra
arsenal_fol_extra <- lapply(arsenal$screen_name[16],
get_friends, token = token)
arsenal_fol_extra <- bind_rows(arsenal_fol_extra)

#join together
arsenal_fol_all <- rbind(arsenal_fol_all,arsenal_fol_extra)

#people Spurs players are following
spurs_fol_all <- lapply(spurs$screen_name, get_friends, token = token)
spurs_fol_all <- bind_rows(spurs_fol_all)
#get extra
spurs_fol_extra <- lapply(spurs$screen_name[16:20],
get_friends, token = token)
spurs_fol_extra <- bind_rows(spurs_fol_extra)

#join together
spurs_fol_all <- rbind(spurs_fol_all,spurs_fol_extra)
Next we have to get all the accounts these players follow. We can apply the get_friends function here. This is limited to 15 accounts at a time. There is a retryonratelimit argument that means you can program R to wait for the Twitter’s rate limit to elapse before trying again, but that didn’t seem to work for me. As there are only 16 Arsenal and 20 Tottenham players in the lists, it wasn’t that much of an issue this time.
The bind_rows function concatenates the list of data frames created by applying get_friends into one handy data frame.
Step 4: combine the two
#combined
fol <- rbind(arsenal_fol_all, spurs_fol_all)
short <- rbind(arsenal_short, spurs_short)
The point of this exercise is to see who follows who on Twitter. If we don’t combine the two data frames before we begin, we won’t know if any players are following their counterparts from the other half of north London.
Step 5: merge
fol_only <- merge(fol, short, by = 'user_id')
Here we will merge the entire data frame of followed accounts from both sets of players with the list of Arsenal and Tottenham player ids, to narrow the list down to just other players.
This leaves us with a data frame that looks like this:
> head(fol_only)
user_id user following team
1 1077840186 ChrisEriksen8 AlderweireldTob 1
2 1077840186 HKane AlderweireldTob 1
3 1077840186 Ben_Davies33 AlderweireldTob 1
4 1077840186 dele_official AlderweireldTob 1
5 1077840186 VictorWanyama AlderweireldTob 1
6 1077840186 JuanMFoyth AlderweireldTob 1
Step 6: prepare the data
graph_data <- as_tbl_graph(fol_only[,2:4]) %>%
tidygraph::mutate(group = group_infomap())
Here we are going to prepare our data for tidygraph and ggraph to plot. We are skipping out the first column of col_only so that it assigns the nodes (the circles in the plot) the actual Twitter handle as a label and not the numeric user ID, which is meaningless to humans.
The mutate function gives the nodes a group (i.e. the team) that we can use to colour the circles in on the plot.
Step 7: plot
graph_data %>% ggraph(layout = 'kk')  +
  geom_edge_parallel(arrow = NULL, aes(color = factor(team), alpha = 0.4)) +
  geom_node_point(size = 8, aes(color = factor(group))) +
  geom_node_text(aes(label = name, size = 3), vjust = -1.2) +
  ggtitle('Which Arsenal and Tottenham players follow each other on Twitter?')  +
  theme_graph() + theme(legend.position = 'none') +
  scale_color_manual(values = c('#E2D4D1','#FF7171')) +
  scale_edge_color_manual(values = c('#E2D4D1','#FF7171'))
I used geom_edge_parallel because geom_edge_link only seemed to show the edges in one direction. If two players follow each other I want that to be displayed in the plot.

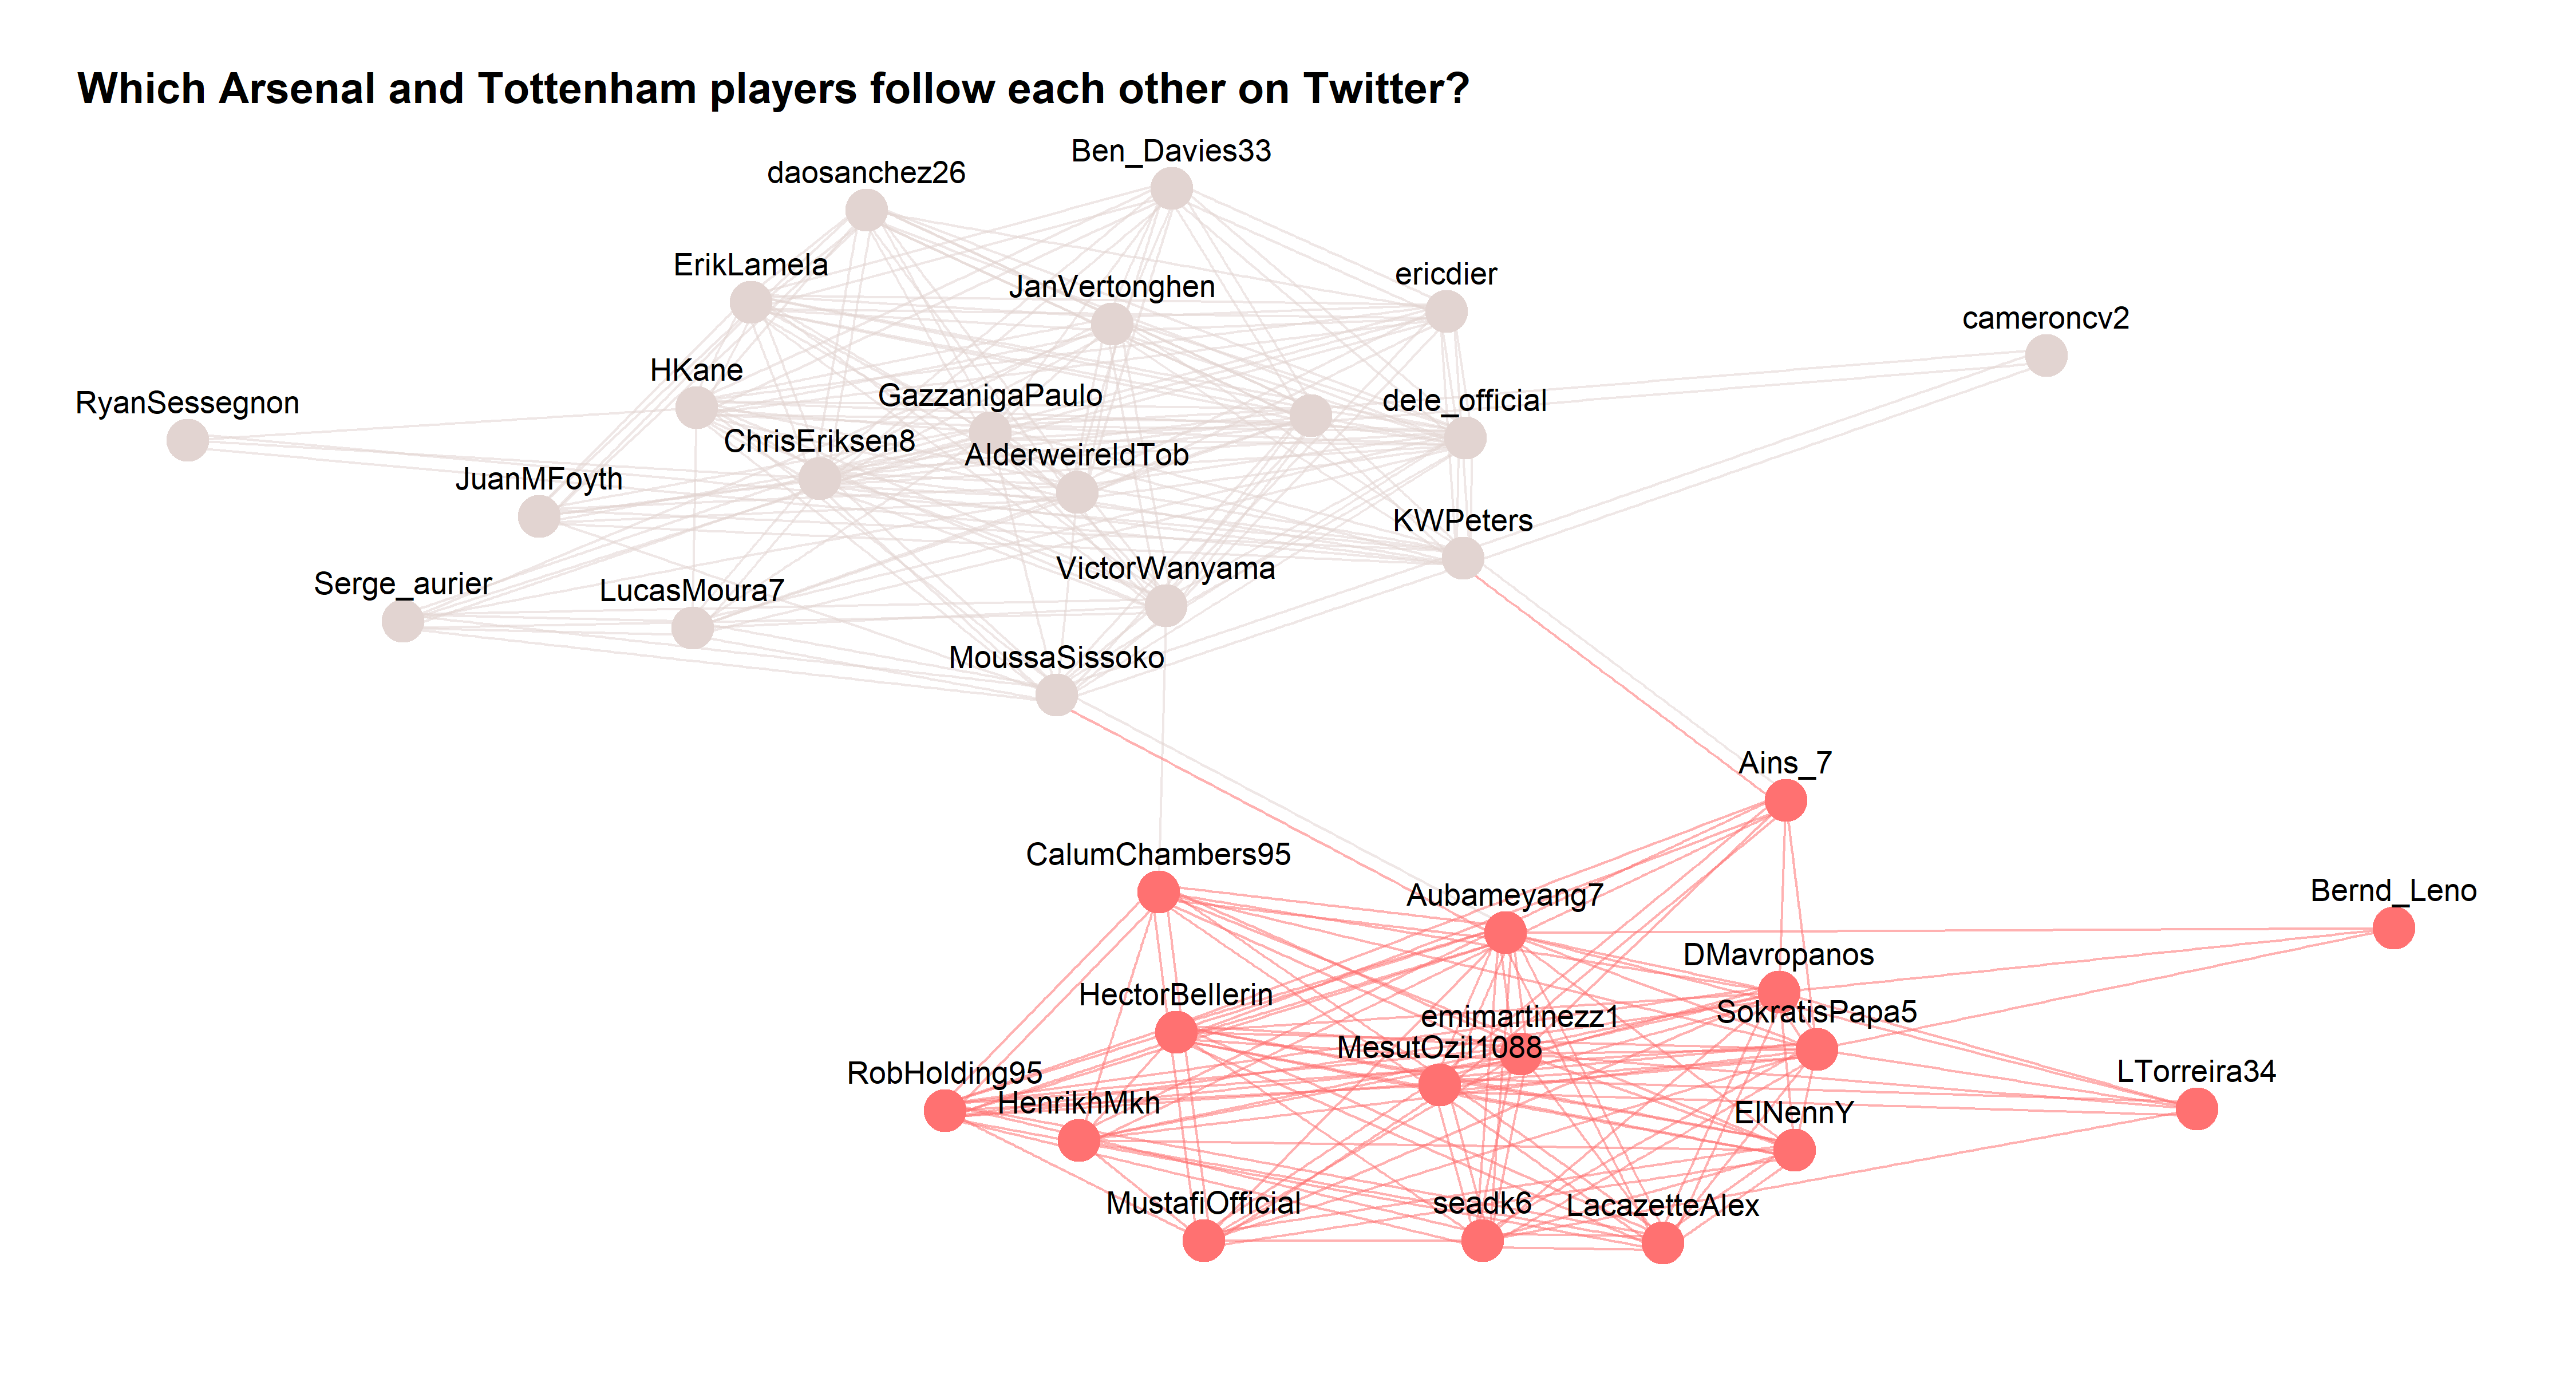
Analysis
For Tottenham, sub keeper Paulo Gazzaniga, defender Toby Alderweireld and Danish midfielder Christian Eriksen are among the Tottenham players followed by many of their teammates.
On the Arsenal side, Mesut Ozil may be out in the cold lately on the pitch but his Arsenal teammates certainly want to hear what he has to say on Twitter.
And there are some links! Arsenal’s star striker Pierre-Emerick Aubameyang and Tottenham’s Moussa Sissoko follow each other, as do Kyle Walker-Peters and Ainsley Maitland-Niles. Victor Wanyama meanwhile follows Calum Chambers.
Conclusion
It can be quite fiddly to get these network graphs right. It requires a lot of tinkering to get the labels and colours correct, but when you do they are a neat way to visualise relationships between different actors.