Skip to content

R for Journalists

Unlock the power of R

  • What Is R?
  • R for Rob
  • GitHub
  • Twitter
  • Etsy
  • Home
  • 2017
  • December
  • 31

Day: December 31, 2017

My First Shiny App: See Where Your Team Ranks in the Football Pyramid

Posted on December 31, 2017January 22, 2020 By Rob
My First Shiny App: See Where Your Team Ranks in the Football Pyramid
See

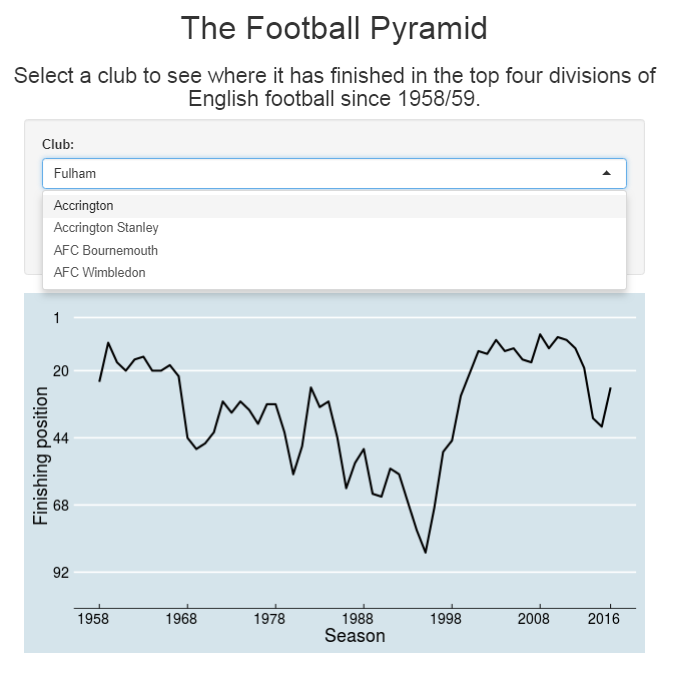
Here is my first Shiny app! Shiny lets you create interactive visualisations in R. It’s a big step forward from the static visualisations we have done thus far. R has a fairly steep learning curve at the beginning. It took me several months and a DataCamp course before I began to know what I was … Read More “My First Shiny App: See Where Your Team Ranks in the Football Pyramid” »
Recent Posts

  • I’ve moved my blog over to Substack
  • How to plot a large rural area using Ordnance Survey data in R
  • Check the COVID-19 vaccination progress in your area
  • Let R tell you what to watch on Netflix
  • Sentiment analysis of Nineteen-Eighty-Four: how gloomy is George Orwell’s dystopian novel?

Archives

  • April 2022
  • April 2021
  • March 2021
  • February 2021
  • January 2021
  • December 2020
  • February 2020
  • December 2019
  • November 2019
  • October 2019
  • April 2018
  • March 2018
  • January 2018
  • December 2017
  • November 2017
  • October 2017
  • September 2017
  • August 2017
  • July 2017
  • May 2017
  • April 2017
  • March 2017
  • February 2017
  • January 2017
  • December 2016
  • November 2016
  • October 2016
  • September 2016

Categories

  • Geospatial data
  • Landmark Atlas
  • Learn
  • See
  • Seen Elsewhere
  • Site
  • Uncategorized

Copyright © 2025 R for Journalists.

Theme: Oceanly by ScriptsTown


Loading Comments...