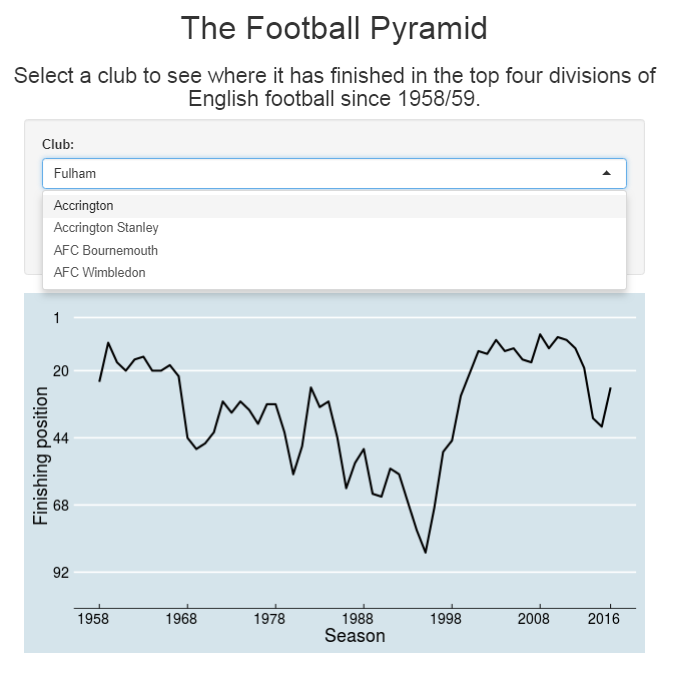
Here is my first Shiny app! Shiny lets you create interactive visualisations in R. It’s a big step forward from the static visualisations we have done thus far. R has a fairly steep learning curve at the beginning. It took me several months and a DataCamp course before I began to know what I was … Read More “My First Shiny App: See Where Your Team Ranks in the Football Pyramid” »
Month: December 2017
Often I use R to handle large datasets, analyse the data and filter out the data I don’t need. When all this is done, I usually use write.csv() to print my data off and reopen it in Google Sheets. My workflow would look something like this: full_data <- read.csv(“some_dataset.csv”) #R analysis ending up with relevant_data write.csv(relevant_data, … Read More “How to Use googlesheets to Connect R to Google Sheets” »
On Tuesday I gave a workshop at the Data Journalism UK conference, run by Paul Bradshaw. This was the worked example for absolute beginners that we went through. If you’ve never looked at R before and want to run some R code, load up this page , copy the following in step by step … Read More “R for Absolute Beginners” »

