Over the past two weeks I’ve been looking at Network Rail’s delays data.
The data tells us how many delays there have been to trains thanks to all kinds of problems that affect the railways, from natural causes such as that seasonal favourite ‘leaves on the line‘ to human causes such as vandalism.
There are lots of different reasons in there, which makes this Network Rail data a rich seam of potential data stories.
It’s vandalism we’ll look at in this post.
Getting the data
Network Rail publish their data in four-week periods, with 13 per year.
To get a full annual picture, we will need to download all 13 of the latest CSVs.
We could use read.csv() to import each one separately. This function works well for just one or two CSVs, but you have to copy/paste the name of each individually.
When you find yourself doing something repeatedly in R, it’s time for a function
There is a neat trick I found here on Stack Overflow for importing multiple CSV files in one go.
For this to work you need all your CSV files in their own working directory, so put them in a separate folder.
For some reason three of the Network Rail files were saved as .CSV rather than as .csv. The code below is case-sensitive. I tried to resave them as .csv but that didn’t work, so I had to do this in two separate stages.
Myfiles and myfiles2 are lists of data frames. The ldply() function afterwards puts them together into one big data frame.
library(plyr)
library(dplyr)
library(tidyr)

temp = list.files(pattern="*.csv")
temp2 = list.files(pattern="*.CSV")
myfiles = lapply(temp, read.delim, sep = ",")
myfiles2 <- lapply(temp2, read.delim, sep = ",")
#combine to make large data frames
df <- ldply(myfiles, data.frame)
df2 <- ldply(myfiles2, data.frame)

year <- rbind(df, df2)
#remove these unnecessary files to save memory
rm(df)
rm(df2)
Now we have the data we want, it’s time to filter for vandalism
Network Rail publish a handy guide [download here] to what the various codes within the data mean.
There are three codes within the ‘Incident Reason’ field that indicate vandalism:
wb <- (subset(year,year$Incident.Reason=="WB"))
wr <- (subset(year,year$Incident.Reason=="WR"))
xb <- (subset(year,year$Incident.Reason=="XB"))
vandalism <- rbind(wb,wr,xb)
I used the subset() function here because a more straightforward filter (i.e. year[year$Incident.Reason == “WB”,]) was turning up NAs in the data.
As a matter of fact, there are no records containing the WB and WR codes in the data, it’s just XB.
Locations
The locations in the data are stored as what are called stanox codes.
There are two stanox codes per delay – one for where the delay started and another for where it ended. These are both in the same column.
I can’t find the precise location of where I found the stanox codes, but they can be found here. They contain both the name of the station and the Network Rail route it is on.
Having two codes presents a slight problem in that a delay could start on one place (e.g. south Wales) and affect another (e.g. Bristol). This makes counting them a bit more difficult than if it were just one destination.
It’s not an insurmountable problem though, we just have to merge the stanox codes twice to get a start and end location.
First of all we’ll use the separate() function in tidyr to separate the columns out.
stanox <- read.csv("stanox.csv")
vandalism <- vandalism %>% separate(Section.Code, into = c("First_location","Second_location"), sep = ":")
locations <- merge(vandalism, stanox, by.x = "Start.Stanox", by.y = "STANOX.NO.", all.x = TRUE)
locations_all <- merge(locations, stanox, by.x = "End.Stanox", by.y = "STANOX.NO.", all.x = TRUE)
The easiest way I found to analyse this data was to take the Network Rail routes.
It is possible to analyse by individual stations, but going by routes saved me a lot of time.
These next commands use the very useful ifelse() function to see whether one or other of the NR.Routes we have just merged contain the areas that I’m interested in.
If they are, we can put an identifier in a new column called TM_Area. At the end of the this process I combined the various areas into a new data frame called tm_areas.
locations_all$TM_Area <- ifelse(locations_all$NR.ROUTE.x == "Wales" | locations_all$NR.ROUTE.y == "Wales", yes = locations_all$TM_Area <- "Wales", no = locations_all$TM_Area <- "not")
 wales <- (subset(locations_all,locations_all$TM_Area=="Wales"))

locations_all$TM_Area <- ifelse(locations_all$NR.ROUTE.x == "Scotland" | locations_all$NR.ROUTE.y == "Scotland", yes = locations_all$TM_Area <- "Scotland", no = locations_all$TM_Area <- "not")
 scotland <- subset(locations_all,locations_all$TM_Area=="Scotland")

locations_all$TM_Area <- ifelse(locations_all$NR.ROUTE.x == "Western" | locations_all$NR.ROUTE.y == "Western", yes = locations_all$TM_Area <- "Western", no = locations_all$TM_Area <- "not")
 western <- subset(locations_all,locations_all$TM_Area=="Western")

locations_all$TM_Area <- ifelse(locations_all$NR.ROUTE.x == "Kent" | locations_all$NR.ROUTE.y == "Kent", yes = locations_all$TM_Area <- "Kent", no = locations_all$TM_Area <- "not")
 kent <- subset(locations_all,locations_all$TM_Area=="Kent")

locations_all$TM_Area <- ifelse(locations_all$NR.ROUTE.x == "East Midlands" | locations_all$NR.ROUTE.y == "East Midlands", yes = locations_all$TM_Area <- "East Midlands", no = locations_all$TM_Area <- "not")
 eastmidlands <- subset(locations_all,locations_all$TM_Area=="East Midlands")

tm_areas <- rbind(wales, scotland, kent, eastmidlands, western)
At this point we need to separate delays and cancellations in order to work out how many minutes of delays there have been (Network Rail’s guide [PDF download] points this out).
The delay codes are ‘A’ and ‘M’, the rest are cancellations. As it happens there were no ‘A’s, just ‘M’s.
delays <- subset(tm_areas,tm_areas$Performance.Event.Code == "A")
delays <- rbind(delays, subset(tm_areas,tm_areas$Performance.Event.Code == "M"))
delays$TM_Area <- factor(delays$TM_Area)
Now we can see how much delay there was (in hours):
delays_byarea <- delays %>%
group_by(TM_Area) %>%
dplyr::summarise(total_delay_hours = (sum(PfPI.Minutes)/60), incidents = n())

> delays_byarea
# A tibble: 5 x 3
 TM_Area total_delay_hours incidents
 <fctr> <dbl> <int>
1 East Midlands 56.00000 550
2 Kent 148.38333 1476
3 Scotland 85.10000 1244
4 Wales 63.10000 573
5 Western 98.66667 1123
A hefty 85 hours of delays due to vandalism in Scotland. This formed the basis of my story in Glasgow Live.
Group_by() and summarise() from the dplyr package are extremely useful. You can use them to pivot the data in any way you want – such as by month or by station:
delays_bymonth <- delays %>%
 group_by(TM_Area, Financial.Year...Period) %>%
 dplyr::summarise(total_delay_hours = (sum(PfPI.Minutes)/60), incidents = n())

delays_bystation <- delays %>%
 group_by(TM_Area, FULL.NAME.x,FULL.NAME.y) %>%
 dplyr::summarise(total_delay_hours = (sum(PfPI.Minutes)/60), incidents = n())
Here’s how that story started:
Vandals caused 85 hours of train delays in Scotland last year, according to Network Rail records – and Glasgow and the capital are the worst affected.
An analysis of more than five million records shows there were 1,244 delays on Scottish routes in the 12 months to June 2017 that were put down to vandalism and theft.
Many of these were knock-on delays caused by earlier problems.
Summary
You have two choices for the location data: the Section Code (where the incident happened) or the Start/End Stanox (where the delay happened).
The fact that there are two different location codes complicates matters slightly, but as we discussed earlier, you just have to cast your net a bit more widely to catch the areas you’re interested in.
You have to be careful with NAs cropping up in this data. I think this is because the data has so many fields (40 variables) and not all of them are complete.
There is a function called complete.cases() that you can use to see whether there are any NAs in each row of a data frame:
df <- data.frame(a = c(1,NA,2),b = c(1,NA,4), c = c(2,4,NA))
complete.cases(df)
> df
a b c
1 1 1 2
2 NA NA 4
3 2 4 NA
> complete.cases(df)
[1] TRUE FALSE FALSE
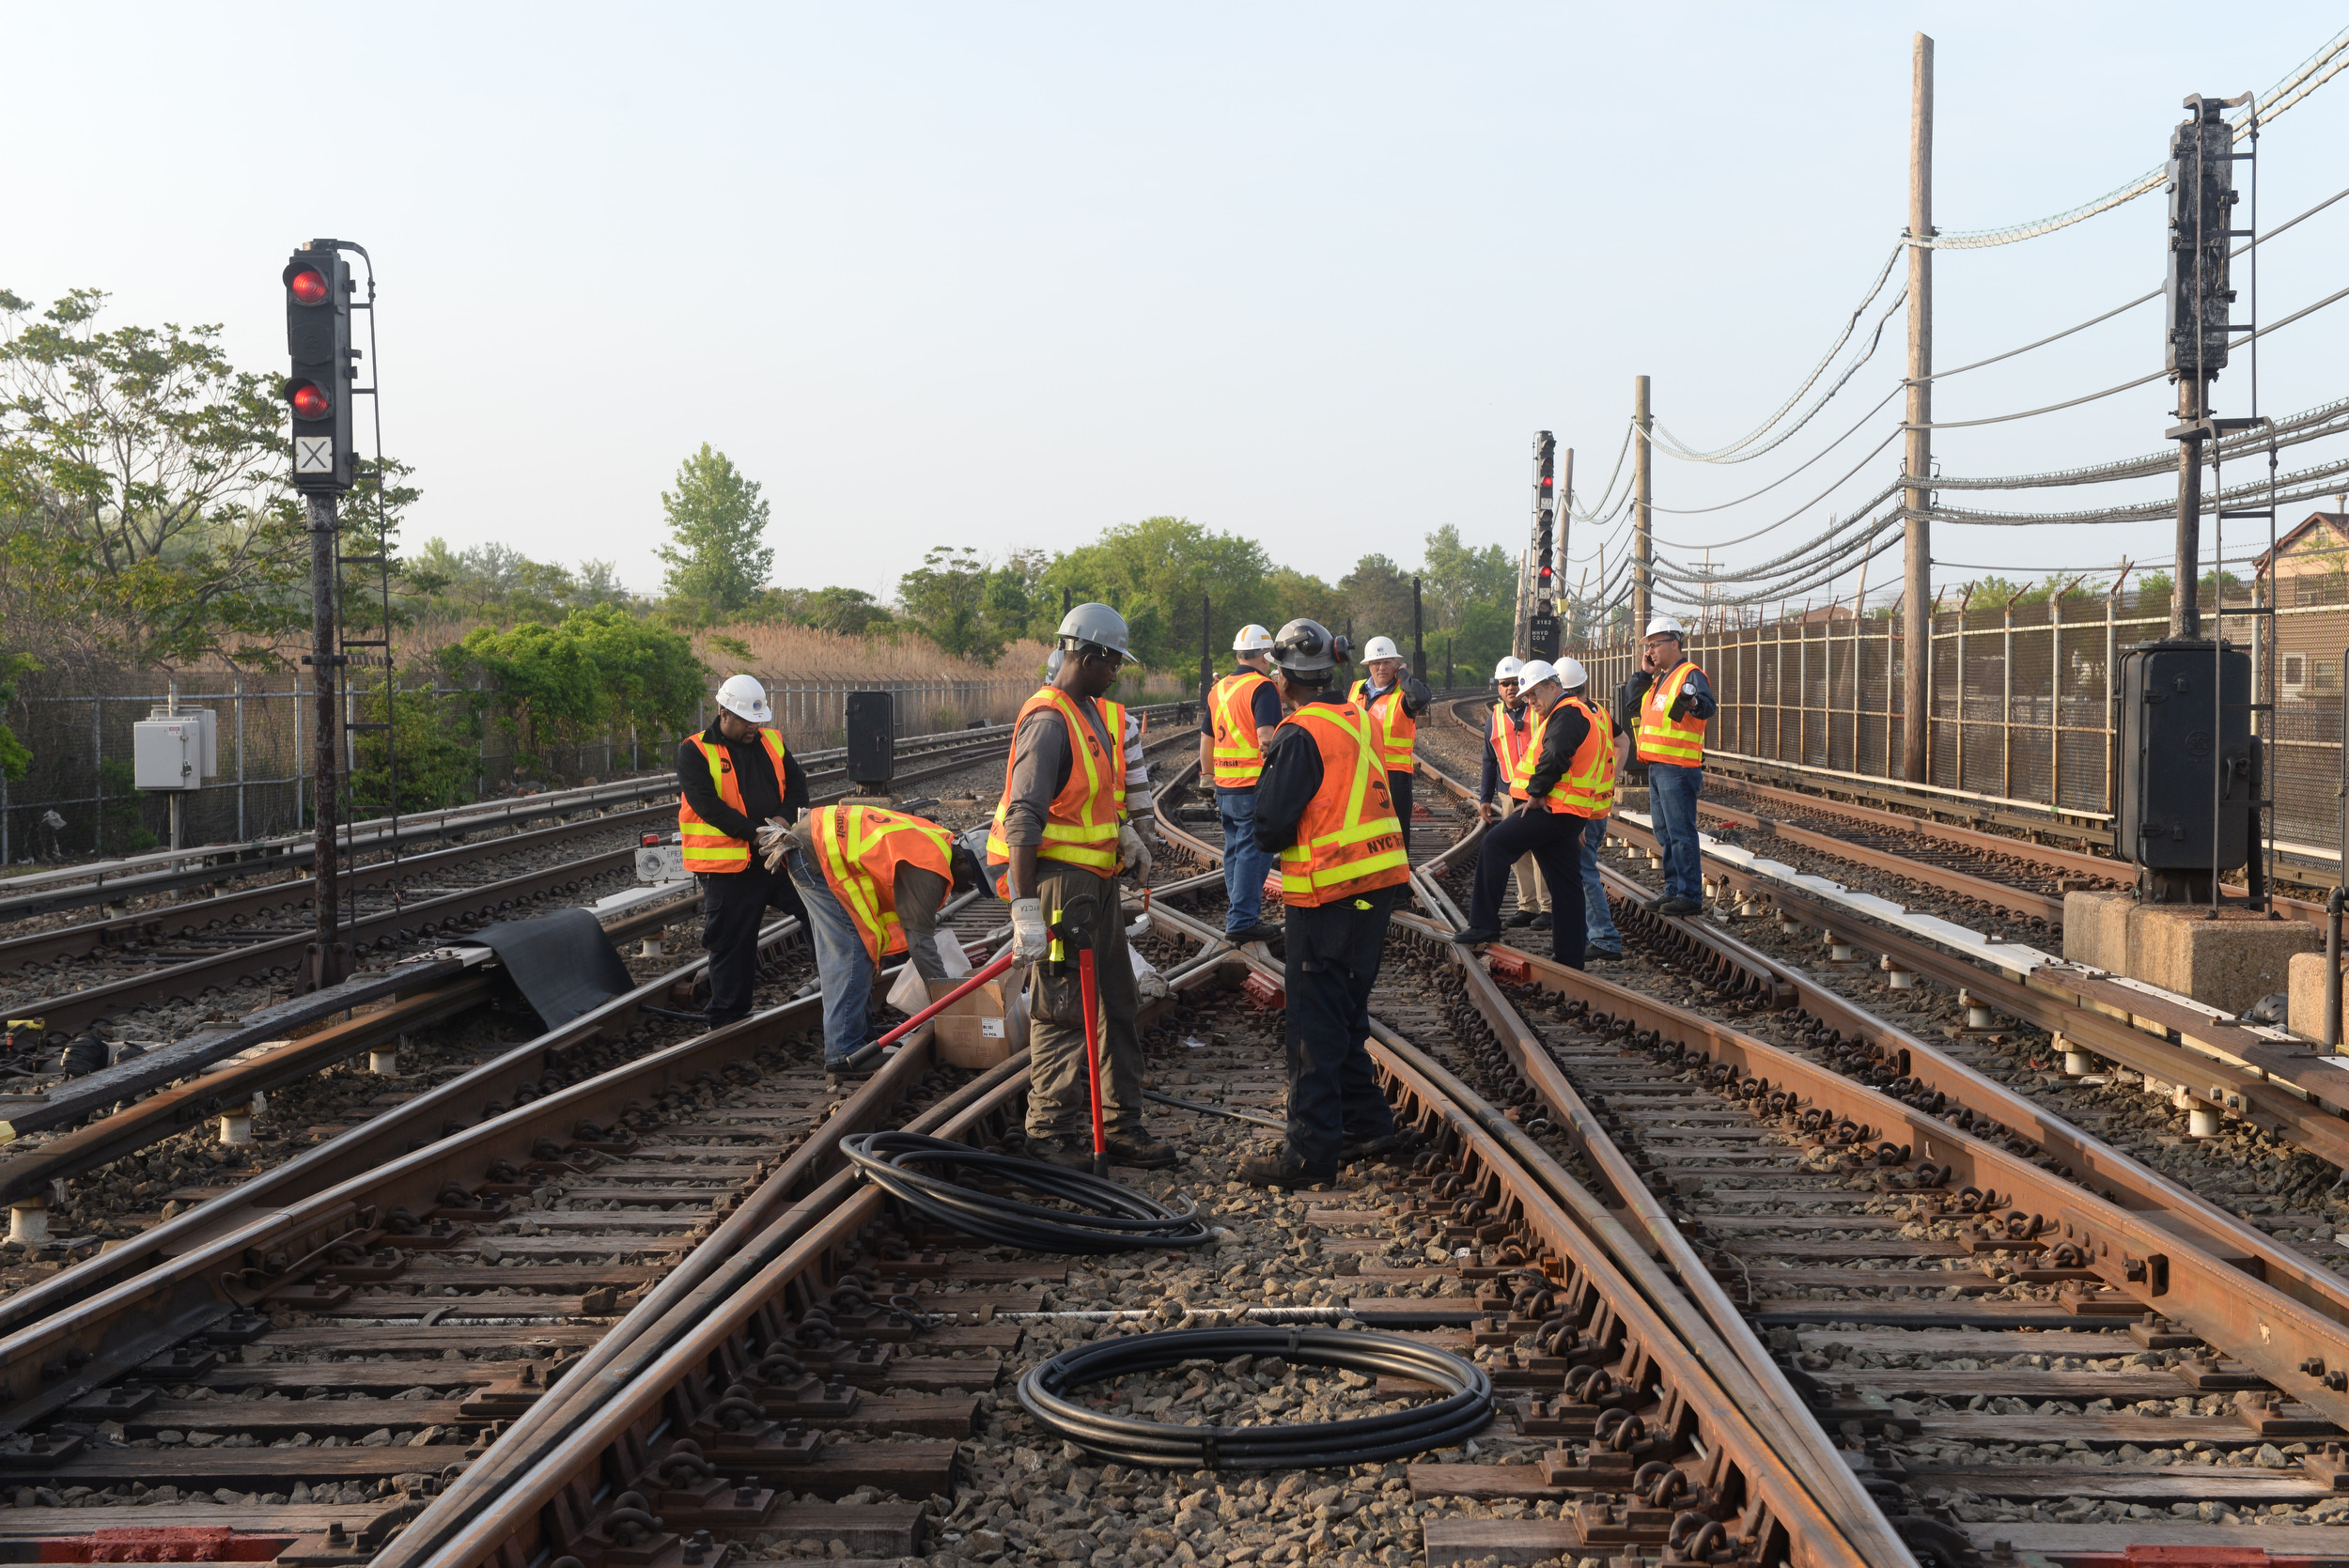
(Photo: MTA New York City Transit / Marc A. Hermann), reused under Creative Commons)
.jpg)