Over the past few years a good source of data has been Parliament’s petitions website. Anyone can start petitions or sign them. MPs have to consider the ones that get to 100,000 signatures for debates. The most popular petitions often end up leading the news cycle, such as the petition arguing for a second EU … Read More “Scraping in R: Access to mortgage petition” »
Month: October 2017
See
See
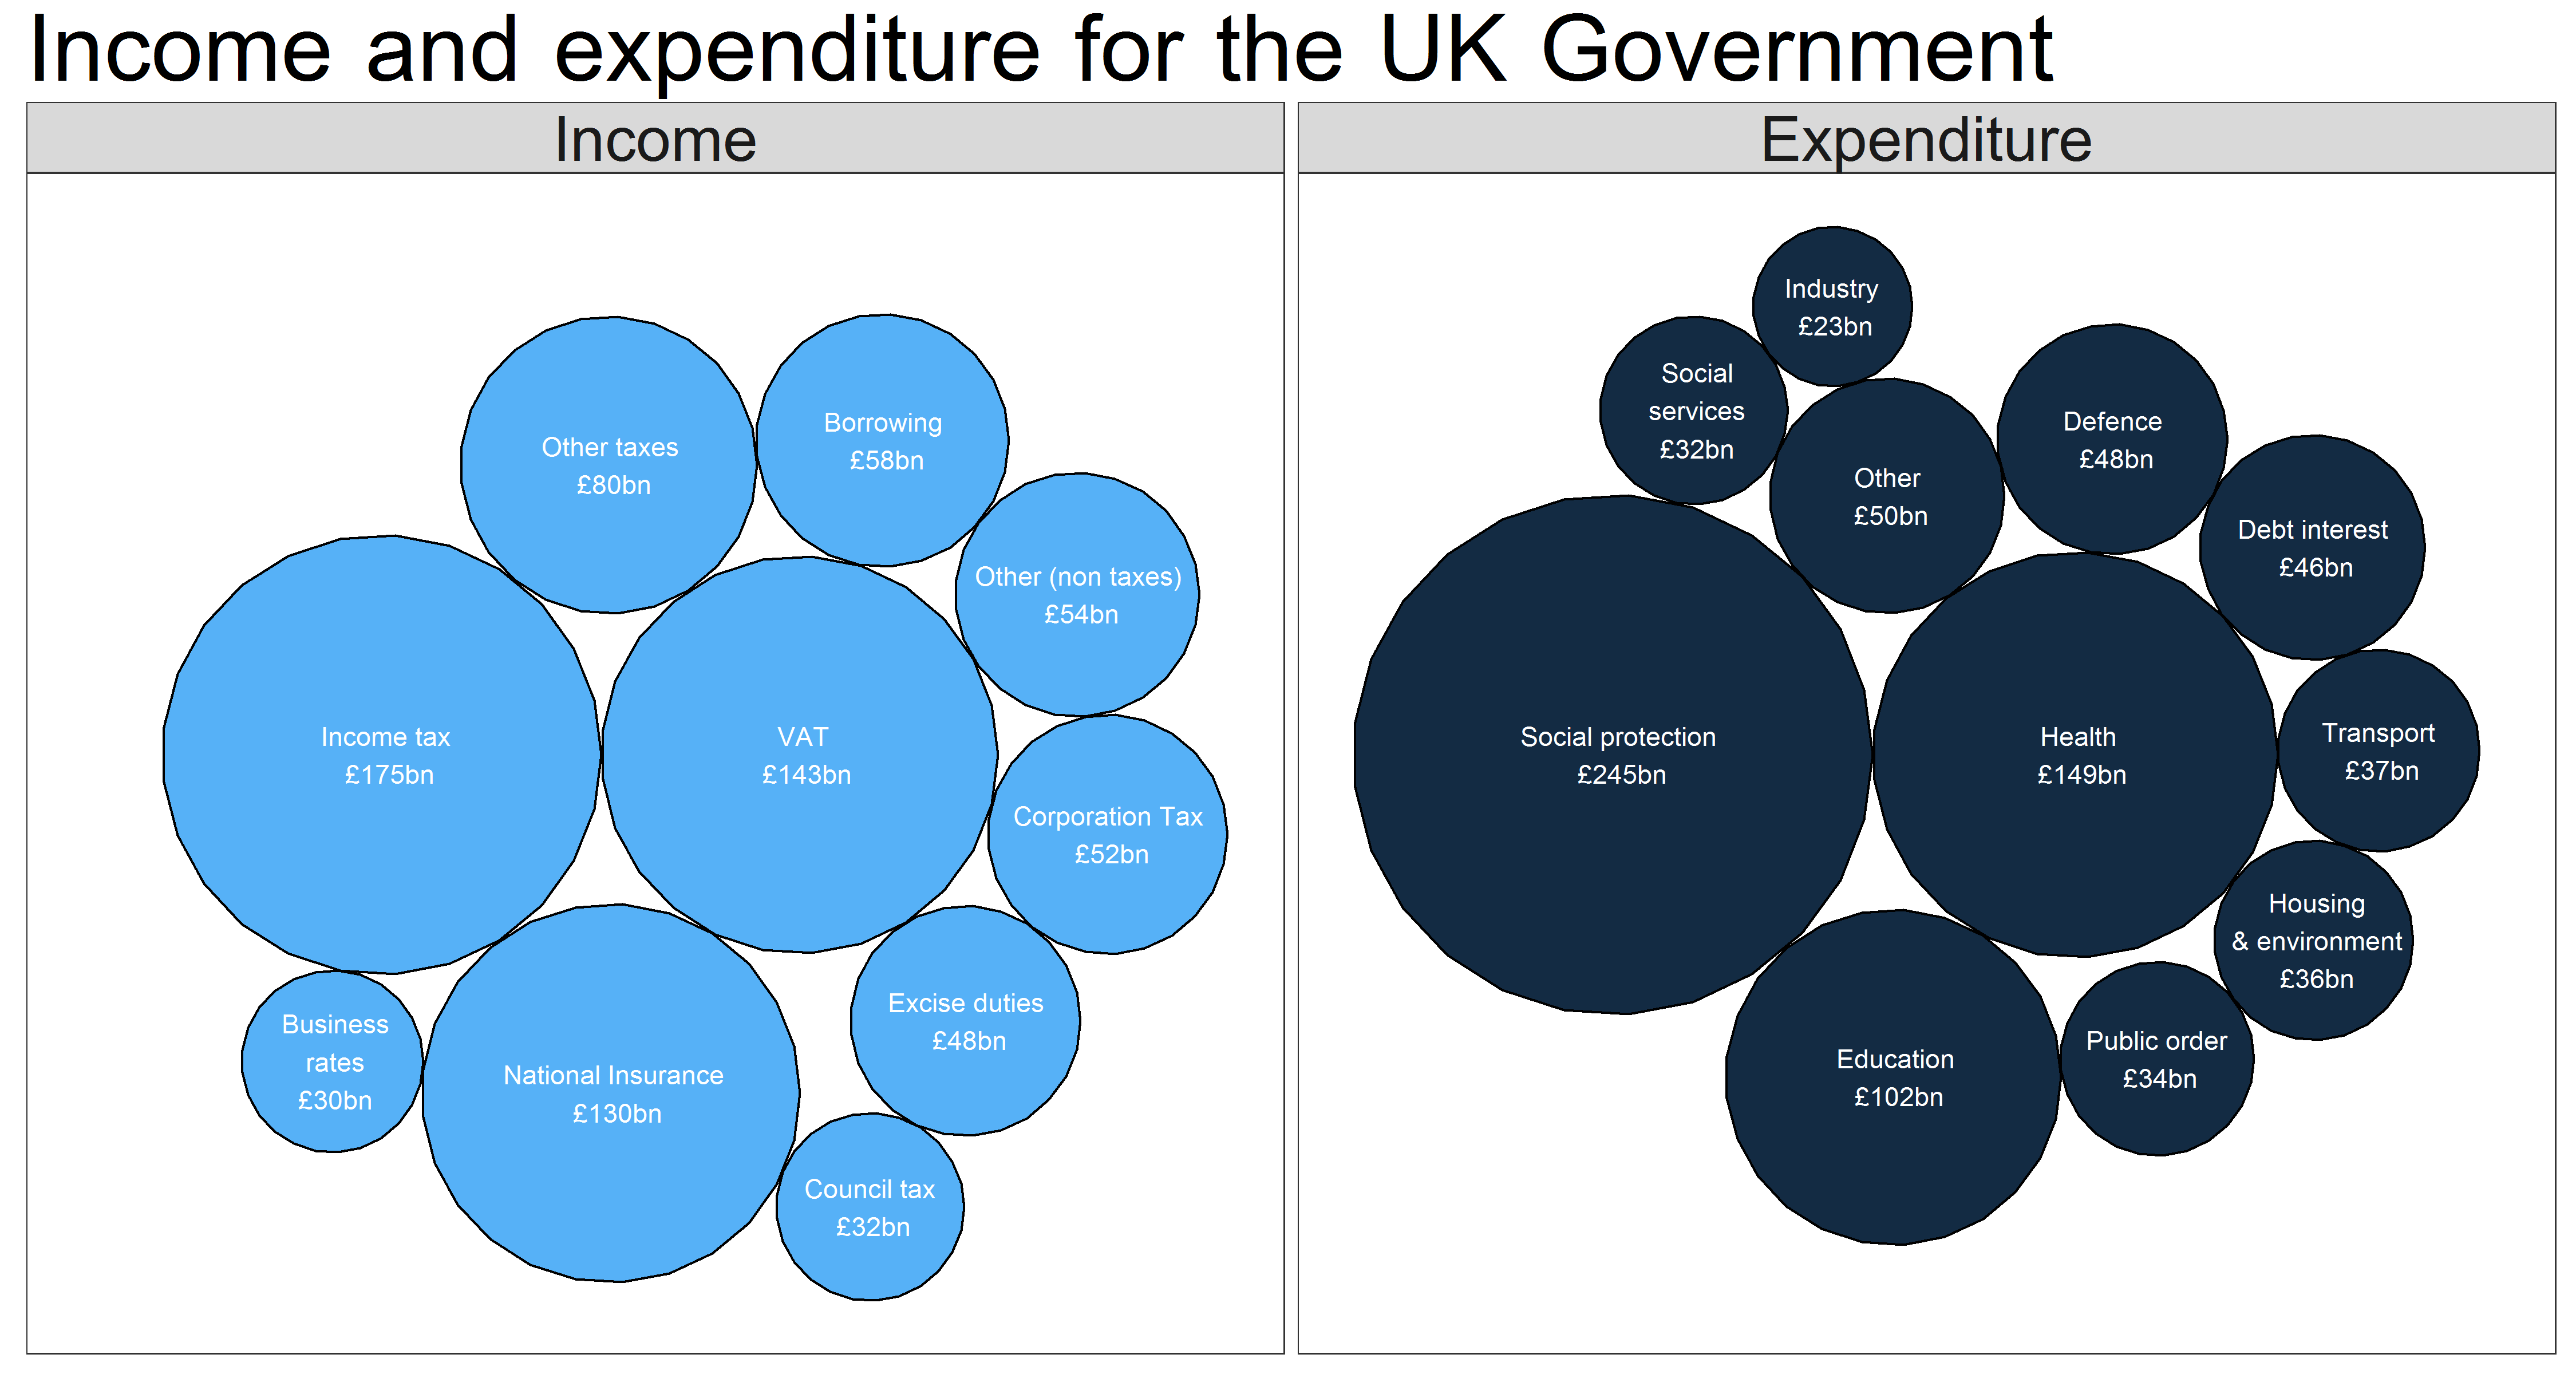
It’s time to branch out into a new area of data visualisation: proportion area plots. These plots use area to show proportion between different related values. A common type of proportional area plots are tree maps. We are going to be using the same principle but with circles. A common subject for area visualisation is … Read More “Spring Budget 2017: Circle visualisation” »

