R has a lot of packages for users to analyse posts on social media. As an experiment in this field, I decided to start with the biggest one: Facebook.
I decided to look at the Facebook activity of Donald Trump and Hillary Clinton during the 2016 presidential election in the United States.
The winner may be more famous for his Twitter account than his Facebook one, but he still used it to great effect to help pick off his Republican rivals in the primaries and to attack Hillary Clinton in the general election.
For this work we’re going to be using the Rfacebook package developed by Pablo Barbera, plus his excellent how-to guide.
The first thing to do is to generate an access token from Facebook’s developer portal. Keep it anonymous (otherwise you’re gifting the world access to your account) and save it in your environment.
library(Rfacebook)
options(scipen = 999)
token <- "Your token goes here"
The next thing to do is to use the getPage() function to retrieve all the posts from each candidate.
I’m going to start the clock on January 1, 2016 and end it the day after the election on November 9, 2016 (which means it will stop on election day, the day before)
trump <- getPage("donaldtrump", token, n = 5000, since='2016/01/01', until='2016/11/09')
clinton <- getPage("hillaryclinton", token, n = 5000, since='2016/01/01', until='2016/11/09')
Caveat: The data doesn’t seem to contain all Trump and Clinton’s Facebook posts
I ran the commands several times and got 545 posts for Trump and 692 posts for Clinton. However I think I may have got more results the first time I ran the commands. I also searched their pages via Facebook and came up with some posts that don’t appear in the R datasets. If you have a solution for this, please let me know!
In the meantime, we will work with what we have
We want to calculate the average number of likes, comments and shares for each month for both candidates. Again, we will be using Pablo’s code for a while here.
First up, we will format the date:
format.facebook.date <- function(datestring) {
 date <- as.POSIXct(datestring, format = "%Y-%m-%dT%H:%M:%S+0000", tz = "GMT")
 }
Then we will use his formula to calculate the average likes, comments and shares (metrics) per month:
aggregate.metric <- function(metric) {
 m <- aggregate(page[[paste0(metric, "_count")]], list(month = page$month),
 mean)
 m$month <- as.Date(paste0(m$month, "-15"))
 m$metric <- metric
 return(m)
 }
Now we run this data for both candidates:
#trump
 page <- trump
 page$datetime <- format.facebook.date(page$created_time)
 page$month <- format(page$datetime, "%Y-%m")
 df.list <- lapply(c("likes", "comments", "shares"), aggregate.metric)
 trump_months <- do.call(rbind, df.list)

> head(trump_months)
 month x metric
 1 2016-01-15 17199.93 likes
 2 2016-02-15 15239.63 likes
 3 2016-03-15 22616.28 likes
 4 2016-04-15 19364.17 likes
 5 2016-05-15 14598.30 likes
 6 2016-06-15 32760.68 likes

#clinton
 page <- clinton
 page$datetime <- format.facebook.date(page$created_time)
 page$month <- format(page$datetime, "%Y-%m")
 df.list <- lapply(c("likes", "comments", "shares"), aggregate.metric)
 clinton_months <- do.call(rbind, df.list)
Before we combine them together, let’s label them so we know who’s who:
trump_months$candidate <- "Donald Trump"
clinton_months$candidate <- "Hillary Clinton"
both <- rbind(trump_months, clinton_months)
Now we have the data, we can visualise it. This is a neat opportunity to have a go at faceting using ggplot2.
Faceting is when you display two or more plots side-by-side for easy at-a-glance comparison.
library(ggplot2)
library(scales)

p <- ggplot(both, aes(x = month, y = x, group = metric)) + geom_line(aes(color = metric)) +
 scale_x_date(date_breaks = "months", labels = date_format("%m")) + ggtitle("Facebook engagement during the 2016 election") + labs(y = "Count", x = "Month (2016)", aesthetic='Metric') + theme(text=element_text(family="Browallia New", color = "#2f2f2d")) + scale_colour_discrete(name = "Metric")

#add in a facet

p <- p + facet_grid(. ~ candidate)

p

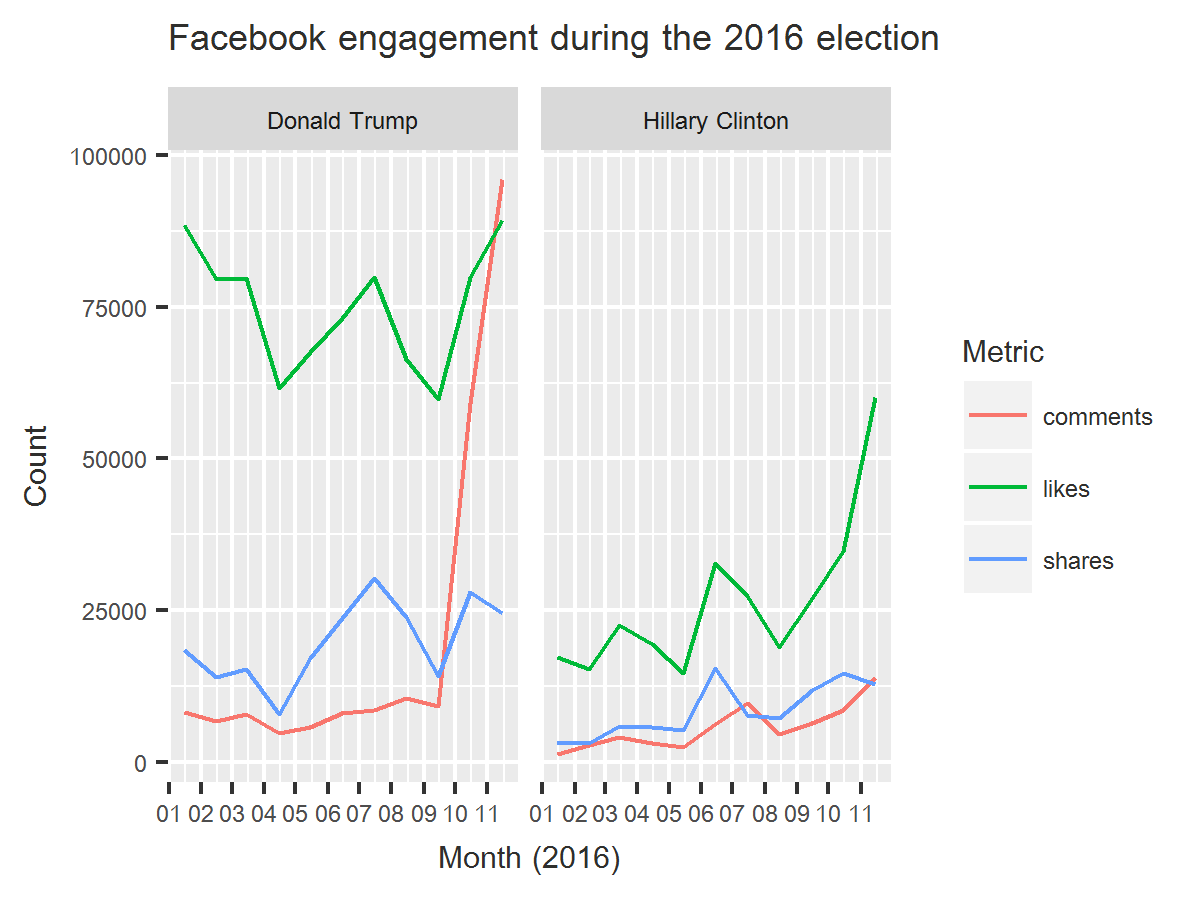
Analysis
Clearly Trump’s Facebook engagement got far better results than Clinton’s.
Even during his ‘off months’ he received more likes per page on average than Clinton managed at the height of the general election.
Trump’s comments per page also skyrocketed during October and November as the election neared.
Hillary Clinton enjoyed a spike in engagement around June. It was a good month for her: she was confirmed as the Democratic nominee and received the endorsement of President Obama.
Themes
Trump is famous for using nicknames for his political opponents and enemies. We had low-energy Jeb, Little Marco, Lyin’ Ted and then Crooked Hillary.
The first usage of Crooked Hillary in the data came on April 26. A look through his Twitter feed shows he seems to have decided on Crooked Hillary around this time as well.
#DrainTheSwamp was one of his later hashtags, making the first appearance in the data on October 20, just a few weeks shy of the election on November 8.
Clinton meanwhile mentioned her rival’s surname in about a quarter of her posts. Her most popular ones were almost all on the eve of the election exhorting her followers to vote.
Of her earlier ones, only her New Year message and one from March appealing to Trump’s temperament resonated as strongly.
Conclusion
It’s frustrating that the API doesn’t seem to retrieve all the data.
Nonetheless it’s a decent sample size and shows that the Trump campaign was far more effective than the Clinton one on Facebook during the 2016 election.
What happens in 2020 if Trump goes up against the man who co-founded it?