In a few months time I will be turning 27 years old.
This means that my 16-25 railcard, commonly known in Britain as a Young Person’s Railcard, won’t be valid any more.
But you’re 26?
I bought my railcard a few days before my 26th birthday, which means I can keep using it until a couple of days before I turn 27.
It saves me a third on all my train tickets.
Once that date passes, I’ll be charged full price for our wonderfully expensive train system.
I wanted to figure out how much my Young Person’s Railcard has saved me over the years.
[NB: it gets technical here. Skip to the end if you want the TL;DR version. Otherwise read on]
So I went back through my advanced bookings I made through TheTrainLine and copied the emails into a huge text file.
I then scraped it with OutWit Hub to extract the date, departure station, arrival station and prices of the 65 journeys I found in my inbox.
Let’s take a look:
'data.frame': 65 obs. of 2 variables:
 $ Date : Factor w/ 65 levels "Friday 05 August 2016",..: 55 32 5 56 41 33 17 16 30 51 ...
 $ actual.cost: Factor w/ 40 levels "£10.90","£11.20",..: 13 10 2 17 25 5 6 25 25 3 ...
The first thing to notice is that R hasn’t read the pound sign correctly. That’s OK, we can use gsub to remove them.
railcard$actual.cost <- as.numeric(gsub("£","",railcard$actual.cost))
R is replacing the dodgy pound sign with a blank. I combined this command with the as.numeric function which converts the character string to a number.
The as.Date function
Take a look at the structure above. You can see that the dates as in the following format:
Friday 05 August 2016
R isn’t reading this as a date. We want it to do this otherwise our line plot won’t work.
The as.Date function solves this for us by converting dates to R’s standard date notation. You input the way the date is currently formatted and R will format it for you to the correct way.
railcard$Date <- as.Date(railcard$Date, format = "%A %d %B %Y" )
The ‘%A’ refers to the day of the week, written out in full (e.g. Friday).
If it was ‘%a’ it would be a shortened day (e.g. Fri).
‘%d refers to the date, %B the month in full (e.g. August) and %Y the year as a four digit number (e.g. 2016).
So we are telling R: ‘We have a date with a full day, date, full month and full year. Convert this to a date for us.’
(This will soon be up on the Cheat Sheet.)
Now it’s time for a bit of maths.
The railcard gives me one third off the price of a journey. Given we know that, we can calculate an estimate for what the journey would have cost at full price:
railcard$estimated.cost <- railcard$actual.cost/0.666666666
Subtracting the estimated cost by the actual cost gives us an estimate for the saving:
railcard$saving <- railcard$estimated.cost - railcard$actual.cost
Every time I used my railcard I made a saving. To get an idea of what my total saving has been to date, we need a cumulative (running) total for each row.
For that, we have the wonderfully named cumsum function
railcard$cumulative.saving <- cumsum(railcard$saving)
> head(railcard)
 Date actual.cost estimated.cost saving cumulative.saving
1 2010-12-30 22.90 34.350 11.450 11.450
2 2011-02-19 19.20 28.800 9.600 21.050
3 2011-07-08 11.20 16.800 5.600 26.650
4 2011-08-02 25.15 37.725 12.575 39.225
5 2011-08-07 33.00 49.500 16.500 55.725
6 2011-08-20 12.85 19.275 6.425 62.150
Looking good. Let’s plot the graph
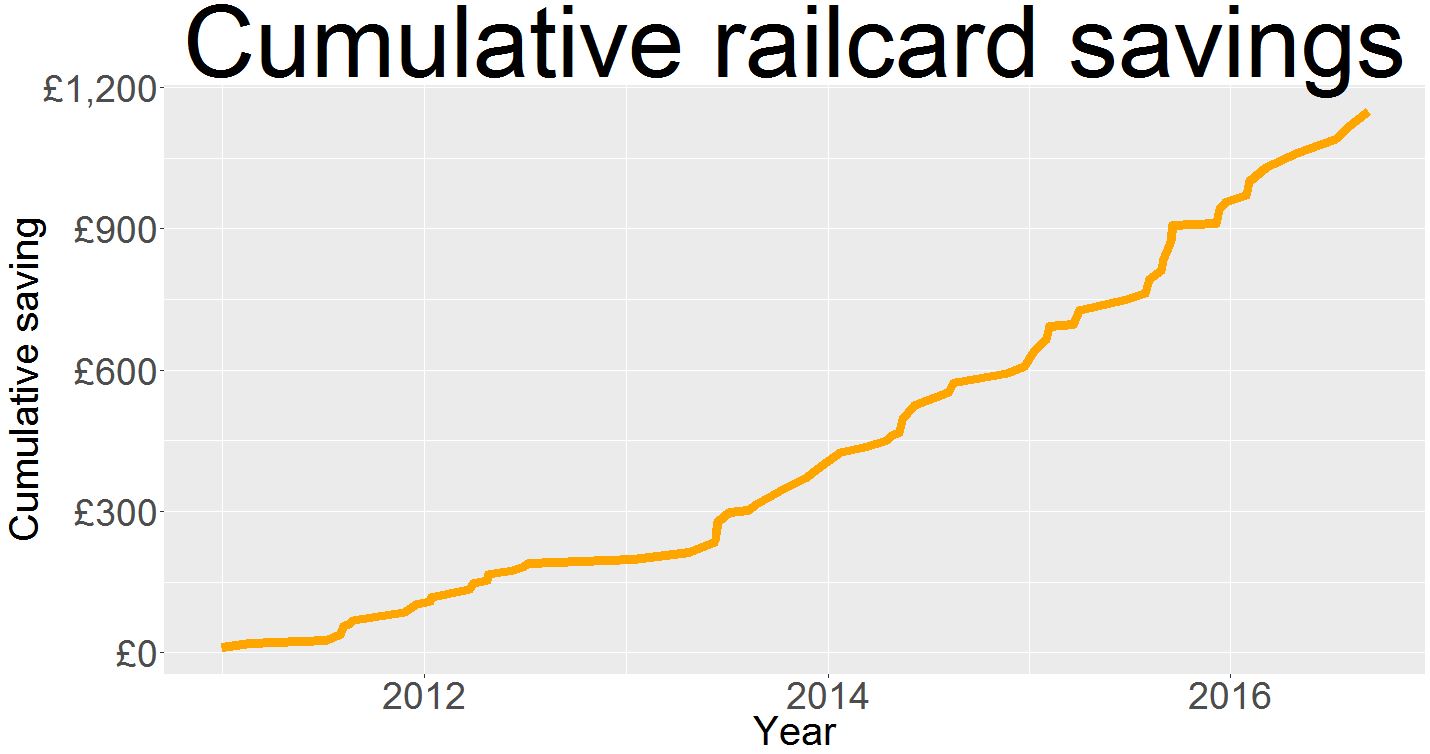
p <- ggplot(railcard, aes(x = Date, y = cumulative.saving)) + geom_line(size = 3.5, color = "orange")
p <- p + ggtitle("Cumulative railcard savings")
p <- p + labs(x = "Year", y = "Cumulative saving")
require(scales)
p <- p + scale_y_continuous(labels = dollar_format(prefix = "£"))
p <- p + theme(plot.title = element_text(size = 75),
 axis.text = element_text(size = 28),
 axis.title = element_text(size = 30))
p

Analysis
From this graph, my Young Person’s railcard looks to have saved me around £1,200 over the past six years.
I had to renew it every year. It currently costs £30. If we assume it cost that much back in 2010 (I’m sure it didn’t), then we have to knock off £210 for the cost of renewing it.
That still leaves a saving of about £1,000.
Of course that doesn’t take into account the many train tickets I’ve bought at train stations on the day using my railcard.
It also doesn’t account for inflation.
This also assumes I used the YP railcard on each of these journeys, and as far as I remember that’s what I did.
I bet you’d like to know more about where I’ve been on all these journeys.
But that’s private, so I won’t be telling you…