Skip to content

R for Journalists

Unlock the power of R

  • What Is R?
  • R for Rob
  • GitHub
  • Twitter
  • Etsy
  • Home
  • 2016
  • November
  • 1
  • Site Stats: October 2016

Site Stats: October 2016

Posted on November 1, 2016November 1, 2016 By Rob
Site

Summary:

October was this site’s first full month of operation.

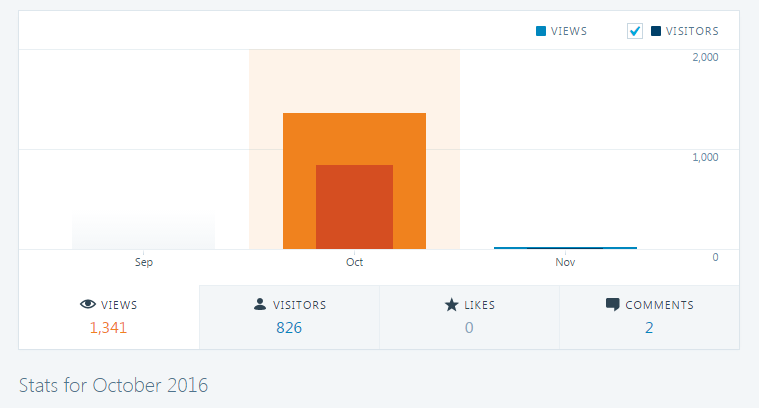
I think the stats for September have disappeared – I think I enabled the stats on WordPress a few days later, so as far as I know this is just October’s data. I’ve tried to minimise looking at the site as a ‘visitor’, which would artificially inflate the stats.

In October the site got more than 1,300 page views from more than 800 visitors.

Posts:

The most popular posts were:

  1. Visualising the Boom in New Flats in Manchester
  2. How Taking the Bus Is a London Thing
  3. Visualising House Prices By Postcode in Leeds
  4. How the North Has the Worst Mental Health in England
  5. Is Unemployment Higher under Labour or the Conservatives?

Remember, you can follow R for Journalists on social media:

  • Twitter
  • Google+
  • Facebook

Share this:

  • Click to share on X (Opens in new window) X
  • Click to share on Facebook (Opens in new window) Facebook

Related

Tags: site stats

Post navigation

❮ Previous Post: Site Design Refresh
Next Post: Dodgy Road Signs, Traffic Lights and Markings: Part One ❯

Recent Posts

  • I’ve moved my blog over to Substack
  • How to plot a large rural area using Ordnance Survey data in R
  • Check the COVID-19 vaccination progress in your area
  • Let R tell you what to watch on Netflix
  • Sentiment analysis of Nineteen-Eighty-Four: how gloomy is George Orwell’s dystopian novel?

Archives

  • April 2022
  • April 2021
  • March 2021
  • February 2021
  • January 2021
  • December 2020
  • February 2020
  • December 2019
  • November 2019
  • October 2019
  • April 2018
  • March 2018
  • January 2018
  • December 2017
  • November 2017
  • October 2017
  • September 2017
  • August 2017
  • July 2017
  • May 2017
  • April 2017
  • March 2017
  • February 2017
  • January 2017
  • December 2016
  • November 2016
  • October 2016
  • September 2016

Categories

  • Geospatial data
  • Landmark Atlas
  • Learn
  • See
  • Seen Elsewhere
  • Site
  • Uncategorized

Copyright © 2025 R for Journalists.

Theme: Oceanly by ScriptsTown