Skip to content

R for Journalists

Unlock the power of R

  • What Is R?
  • R for Rob
  • GitHub
  • Twitter
  • Etsy
  • Home
  • 2016

Year: 2016

Where Does Your Team Rank in the Boxing Day League table?

Posted on December 26, 2016 By Rob 1 Comment on Where Does Your Team Rank in the Boxing Day League table?
Where Does Your Team Rank in the Boxing Day League table?
See

Boxing Day is the most wonderful time of year for football fans. In Britain we have a traditional busy calendar of fixtures the day after Christmas. Television dictates that the matches no longer all kick off at 3pm on 26th December but this year we have 16 of the 20 Premier League clubs playing today. So … Read More “Where Does Your Team Rank in the Boxing Day League table?” »

How Will Barack Obama Go Down in the Rankings of US Presidents?

Posted on November 8, 2016 By Rob 1 Comment on How Will Barack Obama Go Down in the Rankings of US Presidents?
How Will Barack Obama Go Down in the Rankings of US Presidents?
See

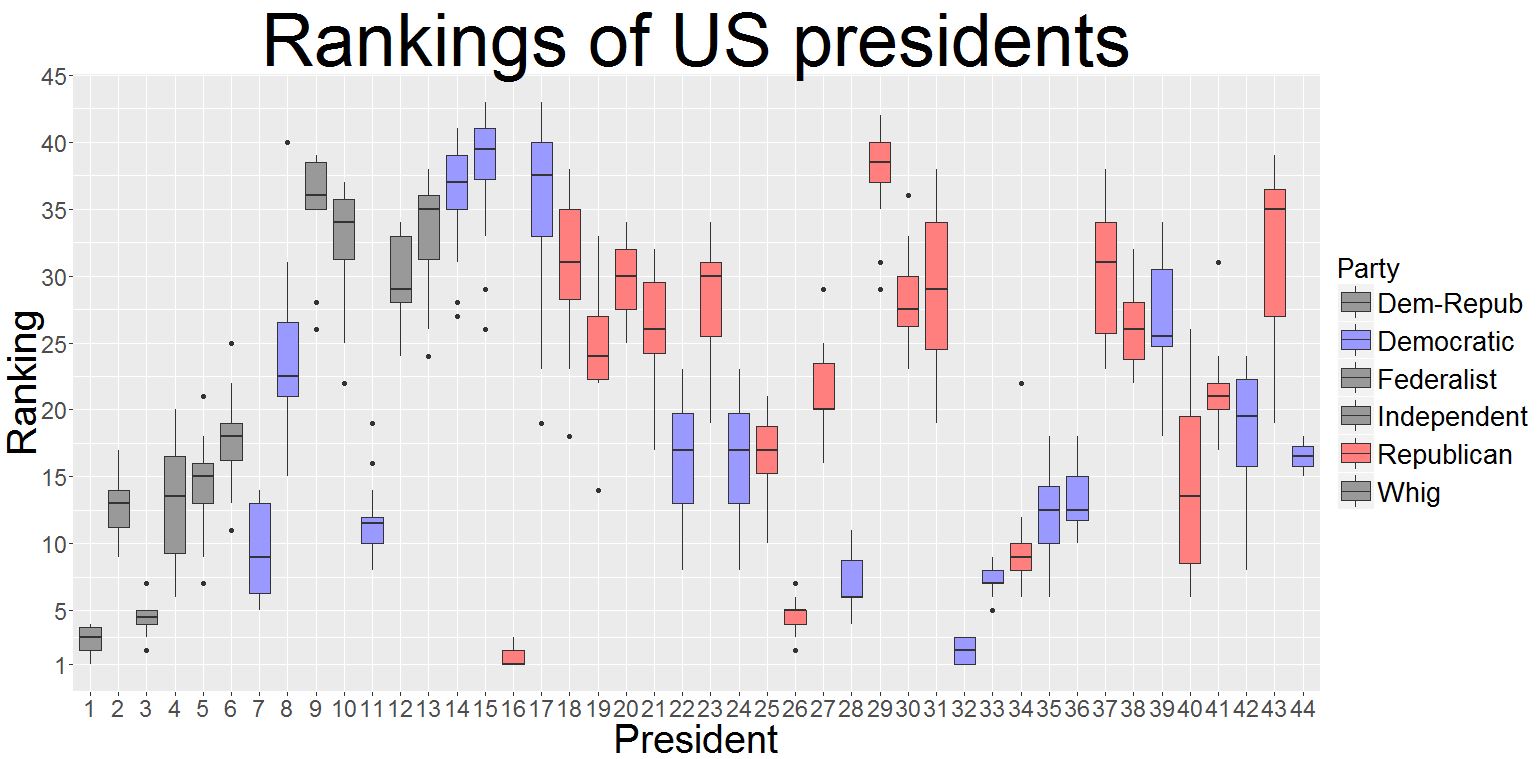
Americans are voting today to choose their 45th president. Come January, Barack Obama will leave the White House after eight years as President of the United States. So how will he be remembered? Historians are already trying to place Obama in the rankings of US presidents. I took this list of 18 different surveys from Wikipedia. It … Read More “How Will Barack Obama Go Down in the Rankings of US Presidents?” »

Andy Murray’s Long Road to the Top

Posted on November 7, 2016 By Rob
Andy Murray’s Long Road to the Top
See

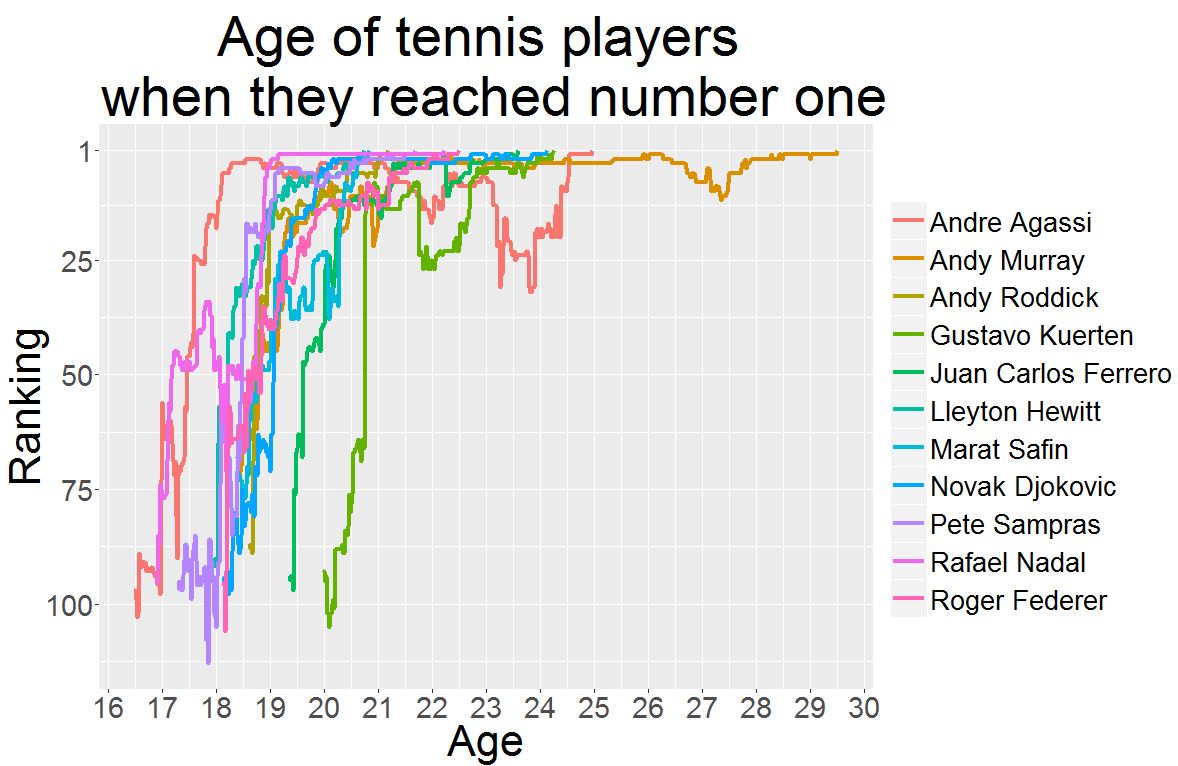
Andy Murray was crowned as the world number one in men’s tennis for the first time today. The two-time Wimbledon champion has long been out on his own as Britain’s best male tennis player and now he’s managed to overhaul Novak Djokovic at the summit of the game. It took Andy Murray a lot longer … Read More “Andy Murray’s Long Road to the Top” »

How Much Money Has My Young Person’s Railcard Saved Me?

Posted on November 6, 2016 By Rob
How Much Money Has My Young Person’s Railcard Saved Me?
See

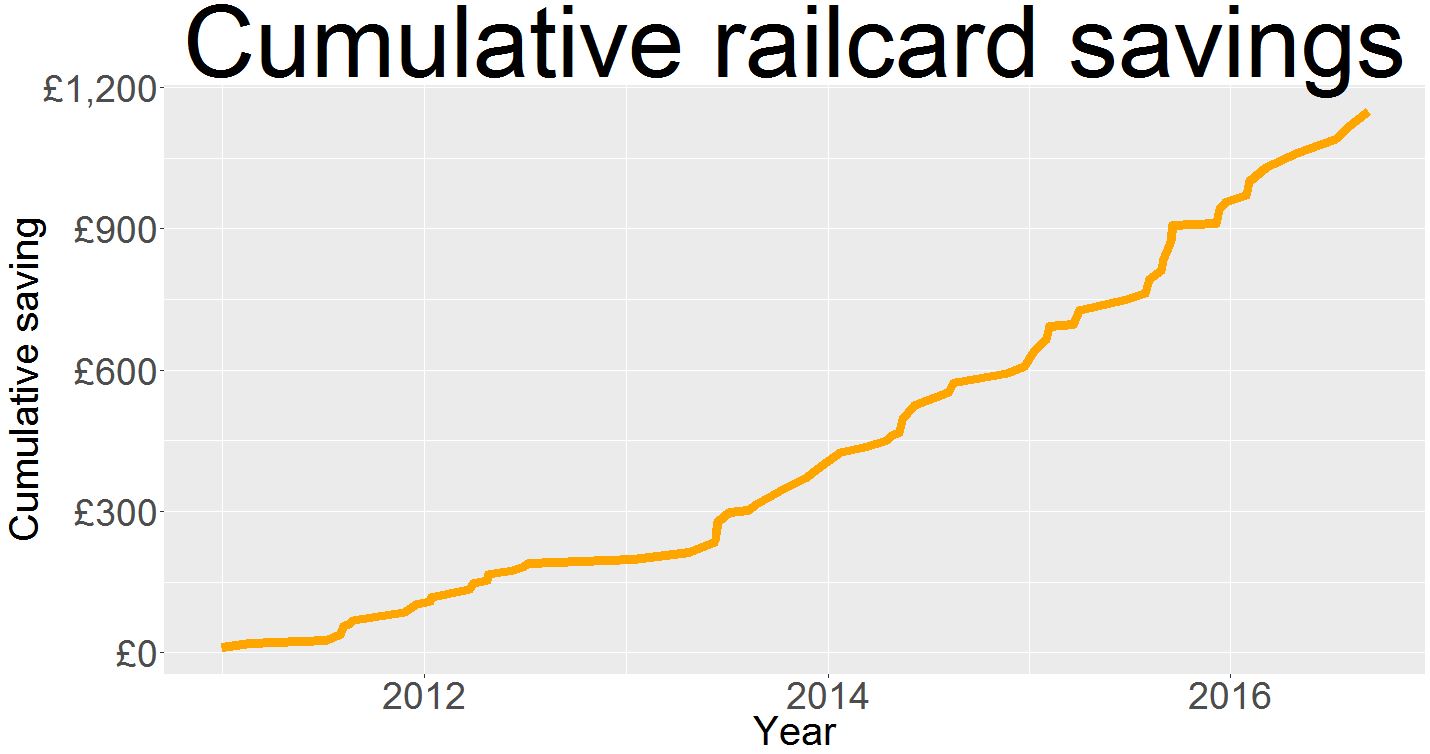
In a few months time I will be turning 27 years old. This means that my 16-25 railcard, commonly known in Britain as a Young Person’s Railcard, won’t be valid any more. But you’re 26? I bought my railcard a few days before my 26th birthday, which means I can keep using it until a couple … Read More “How Much Money Has My Young Person’s Railcard Saved Me?” »

Dodgy Road Signs, Traffic Lights and Markings: Part Two

Posted on November 5, 2016 By Rob
Dodgy Road Signs, Traffic Lights and Markings: Part Two
See

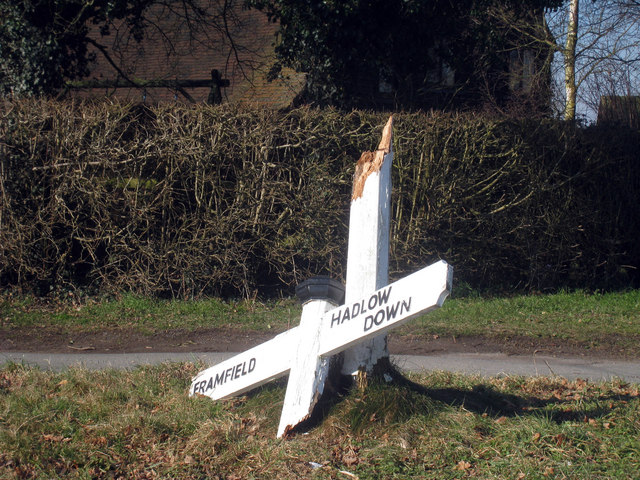
At the end of the last post, we had our data in a file named defective. The data contains all the injuries caused by car accidents where a road sign, signal or marking was obscured or not working properly from 2010 to 2015 (4,672 in total). To R or not to R? We could continue to … Read More “Dodgy Road Signs, Traffic Lights and Markings: Part Two” »

Seen Elsewhere: 4th November 2016

Posted on November 4, 2016November 4, 2016 By Rob
Seen Elsewhere: 4th November 2016
Seen Elsewhere

Welcome to the third edition of Seen Elsewhere, my round-up of good stuff I’ve seen in the field of R and data journalism this week.

Read More “Seen Elsewhere: 4th November 2016” »

Dodgy Road Signs, Traffic Lights and Markings: Part One

Posted on November 2, 2016 By Rob
Dodgy Road Signs, Traffic Lights and Markings: Part One
See

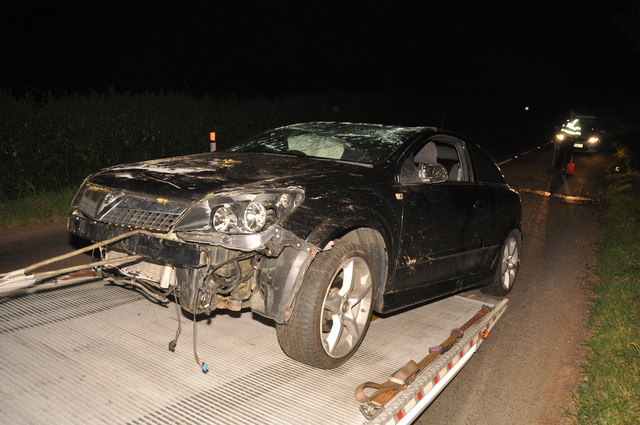
One of the most detailed UK government datasets I’ve ever seen is the STATS19 data from the Department for Transport. This is the collated reports of road accidents in Great Britain in which at least one person was injured or killed. It records all kinds of details, from the basics such as the date, time … Read More “Dodgy Road Signs, Traffic Lights and Markings: Part One” »

Site Stats: October 2016

Posted on November 1, 2016November 1, 2016 By Rob
Site Stats: October 2016
Site

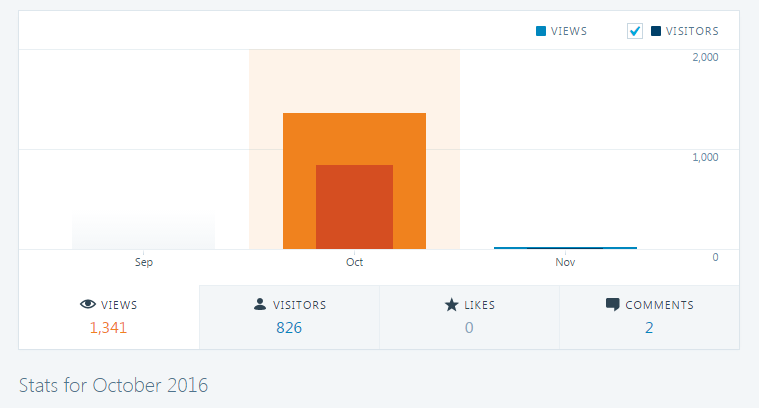
Summary: October was this site’s first full month of operation. I think the stats for September have disappeared – I think I enabled the stats on WordPress a few days later, so as far as I know this is just October’s data. I’ve tried to minimise looking at the site as a ‘visitor’, which would artificially inflate … Read More “Site Stats: October 2016” »

Site Design Refresh

Posted on October 31, 2016November 1, 2016 By Rob
Site Design Refresh
Site

You might have noticed the site looks different to how it did before. I changed themes to the Tribute theme on WordPress. I find this theme handles my featured images better, which allows me to show the thumbnails on the homepage. All feedback welcome! 

Seen Elsewhere: 28th October 2016

Posted on October 28, 2016October 31, 2016 By Rob
Seen Elsewhere: 28th October 2016
Seen Elsewhere

Welcome back to Seen Elsewhere, my round-up of good stuff I’ve seen in R and data journalism this week.

Read More “Seen Elsewhere: 28th October 2016” »

Posts pagination

1 2 3 Next

Recent Posts

  • I’ve moved my blog over to Substack
  • How to plot a large rural area using Ordnance Survey data in R
  • Check the COVID-19 vaccination progress in your area
  • Let R tell you what to watch on Netflix
  • Sentiment analysis of Nineteen-Eighty-Four: how gloomy is George Orwell’s dystopian novel?

Archives

  • April 2022
  • April 2021
  • March 2021
  • February 2021
  • January 2021
  • December 2020
  • February 2020
  • December 2019
  • November 2019
  • October 2019
  • April 2018
  • March 2018
  • January 2018
  • December 2017
  • November 2017
  • October 2017
  • September 2017
  • August 2017
  • July 2017
  • May 2017
  • April 2017
  • March 2017
  • February 2017
  • January 2017
  • December 2016
  • November 2016
  • October 2016
  • September 2016

Categories

  • Geospatial data
  • Landmark Atlas
  • Learn
  • See
  • Seen Elsewhere
  • Site
  • Uncategorized

Copyright © 2025 R for Journalists.

Theme: Oceanly by ScriptsTown


Loading Comments...